Hello, we are Emmanuel and Deepanjali, and this summer, we’ve been tormenting several particles to study the proton energy loss through thin gold films to study neutron half-life.Neutrons tend to be shy about their age, however we nosy humans are on a hunt to discover their half life. The half-life of a neutron is the time taken by half of a given number of neutrons to decay. Neutrons decay into protons, electrons, and antineutrinos through a process known as beta decay. Understanding neutron half-life is quintessential in understanding physics- elemental abundance in the universe, fundamental particle interactions and ultimately understanding the origin of the universe.
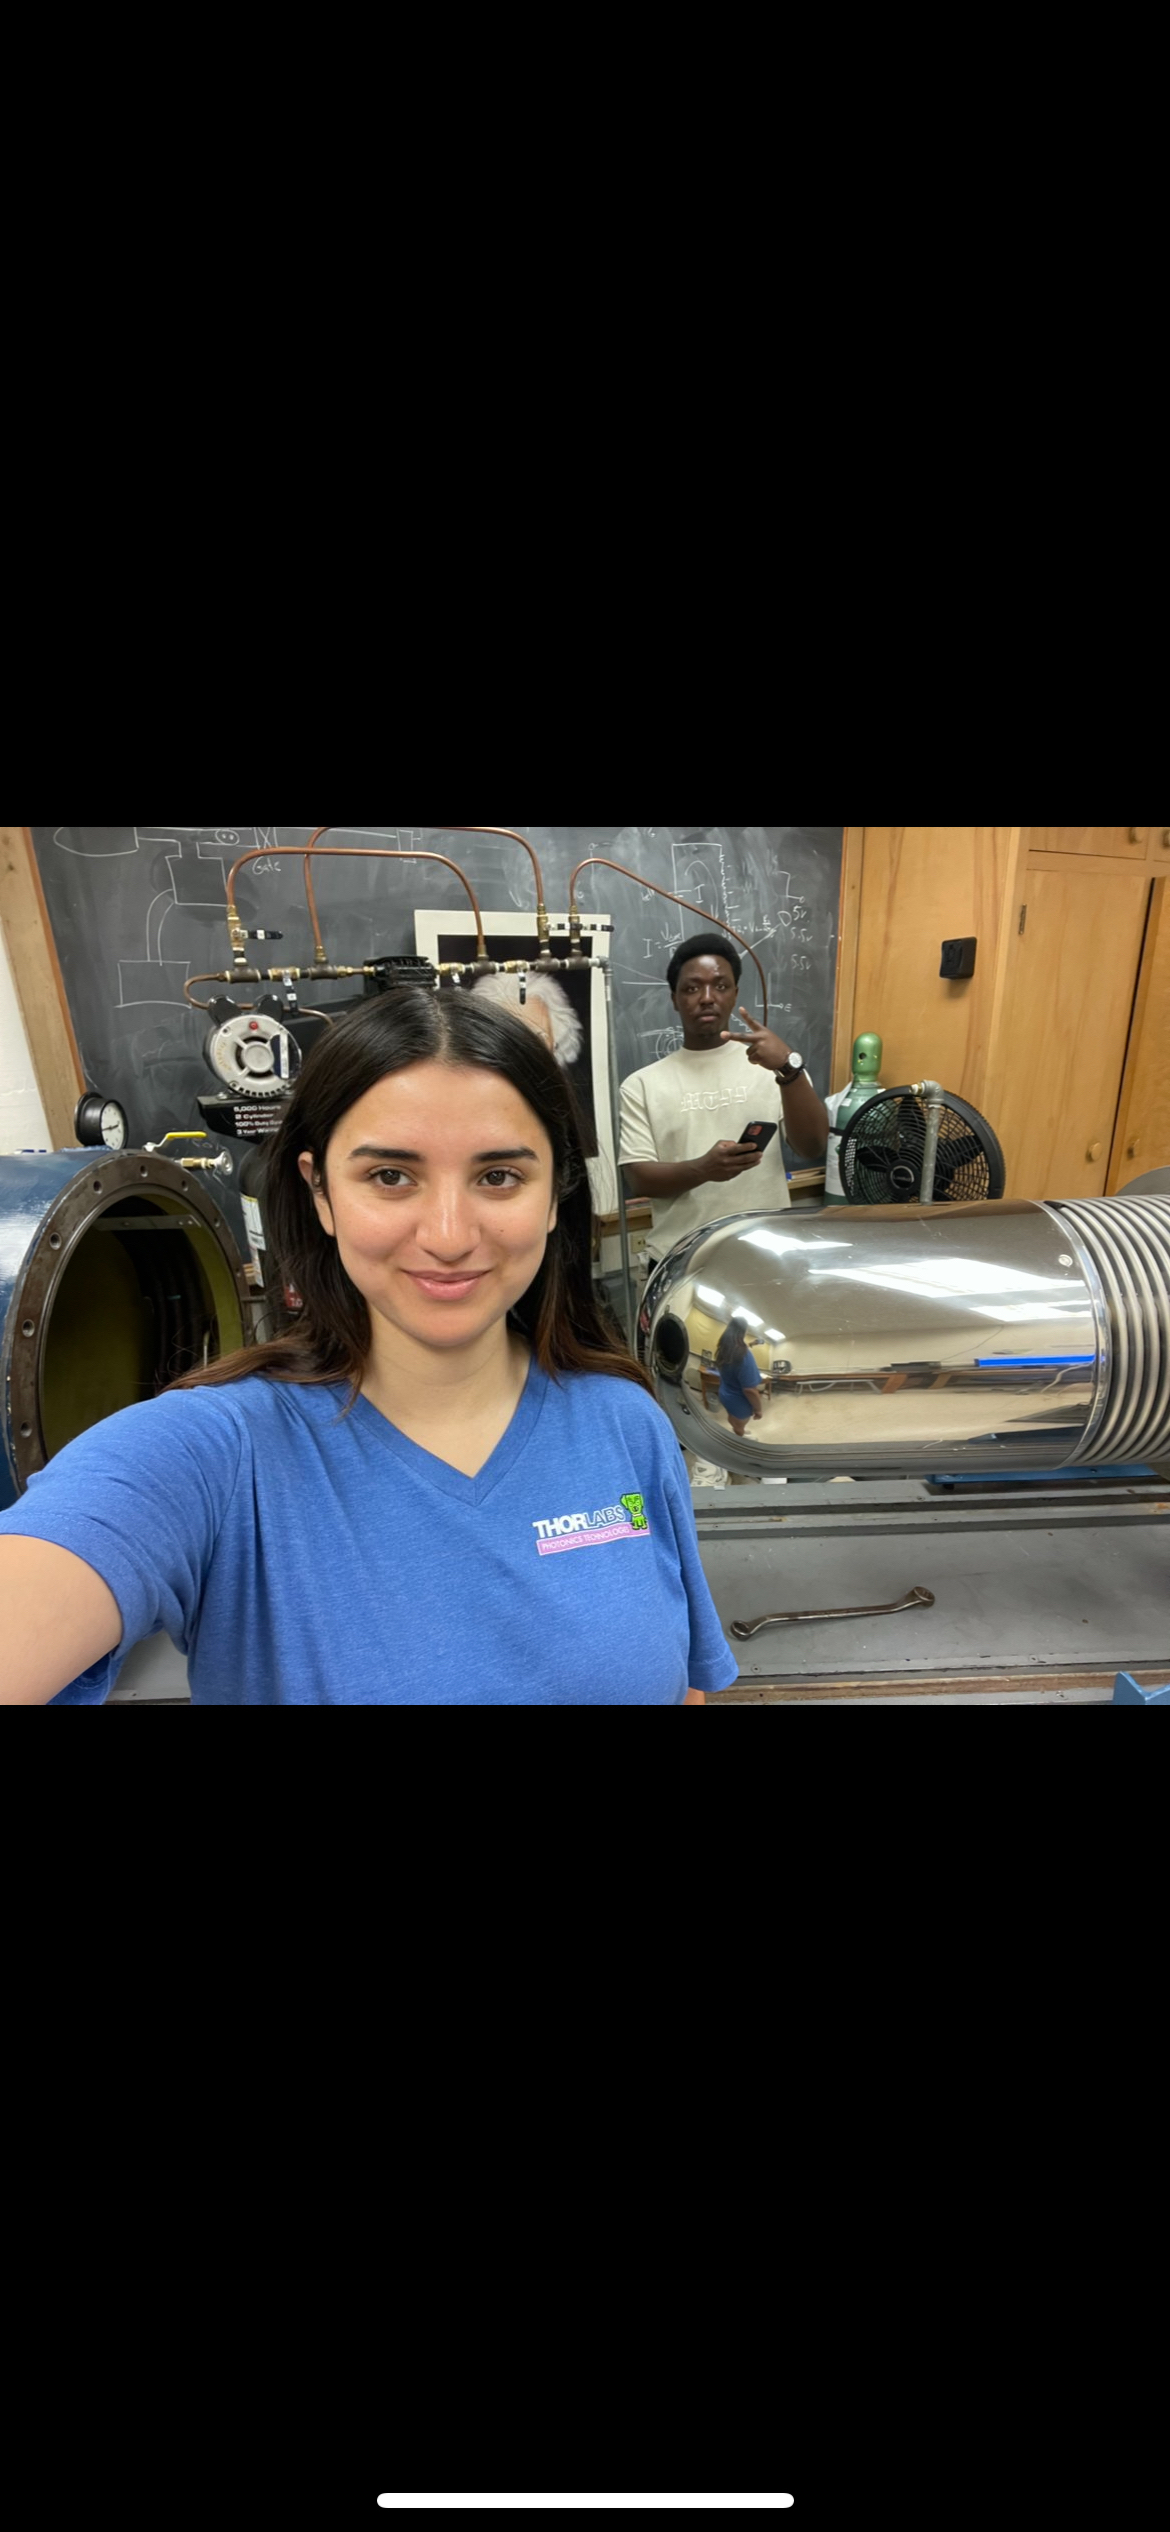
(Image-1: Deepanjali left and Emmanuel right.)
One method of measuring the lifetime of a neutron involves detecting protons decaying from a neuron beam, a technique known as the in-beam method. However, protons witness a loss of energy while passing through a gold layer in gold-based semiconductor detectors, introducing uncertainty to lifetime measurements. In order to address this discrepancy, we are studying how protons loose energy as they enter the proton detectors. We create thin gold films on part of the face of the detector and accurately measure their thickness using UV-Vis Spectroscopy. Then we put protons on the detector, either through the gold film or directly into the detector.
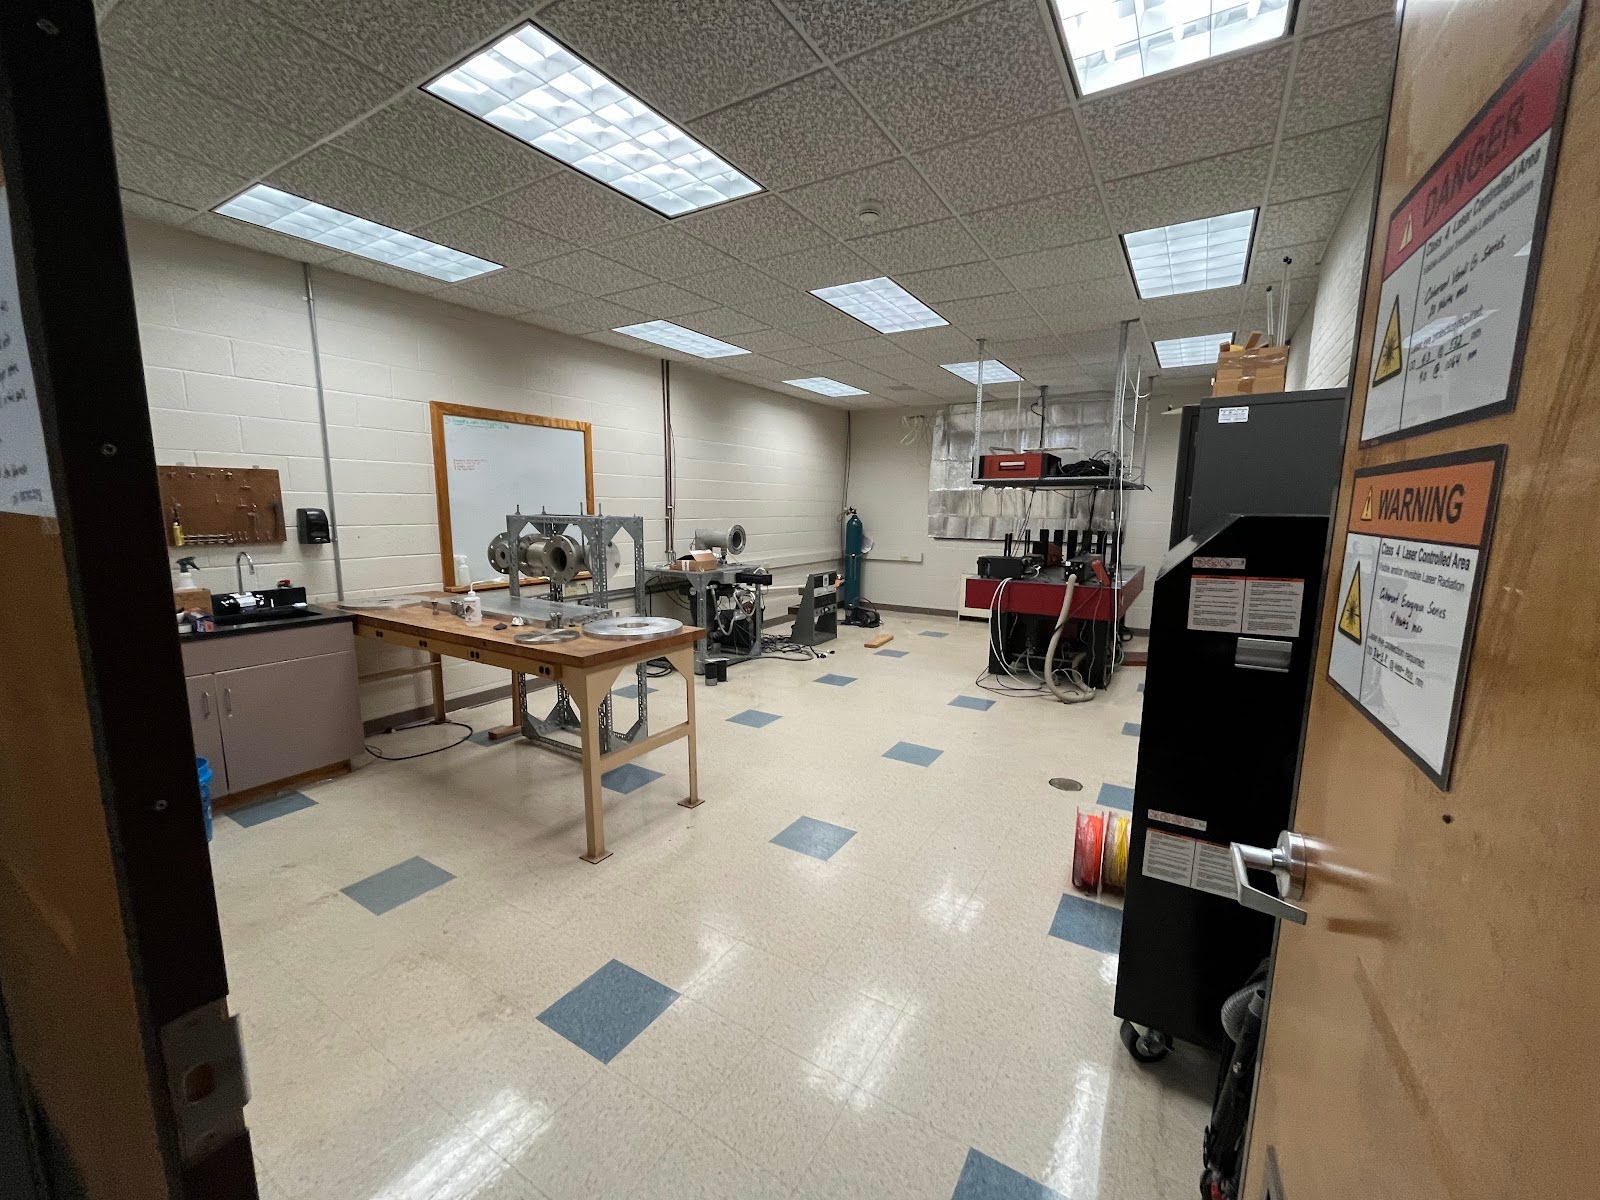
Van de Graff Accelerator
Our journey begins inside the Van de Graaff accelerator, a machine engineered to create a large potential difference for accelerating protons. This is accomplished by transporting charge from the ground up to a higher voltage dome. Imagine a drive motor spinning a rubber belt that contacts a screen, which is connected to a high-voltage supply to manage charge. This year, we addressed two key issues: we replaced the belt and the screen. The old mesh-like screen was damaging the rubber belt (not good).

(Image 2- Van de Graft accelerator without the dome)
A net positive charge is generated on the belt by placing a positive charge on the screen, which attracts electrons away from the belt, leaving it positively charged. This charge is then carried up to the high-voltage dome. Once the charge reaches the dome, a potential difference is established between it and the ground, enabling the acceleration of protons. We can regulate the amount of charge on the dome using corona needles.
The accelerated protons originate from an ion source inside the accelerator, connected to a bottle containing hydrogen. It took considerable time to adjust the bottle to generate the required plasma. By fine-tuning an LC circuit, we managed to produce the appropriate radio frequency (RF) oscillator needed to excite the hydrogen gas, thereby ionizing it into multiple particles within a plasma bottle. A Van de Graaff generator, which generates a substantial electric potential, facilitated the acceleration of ions into a beam tube. Along the beam’s path, strategically positioned pairs of slits ensured the beam is traveling straight down the beam line.
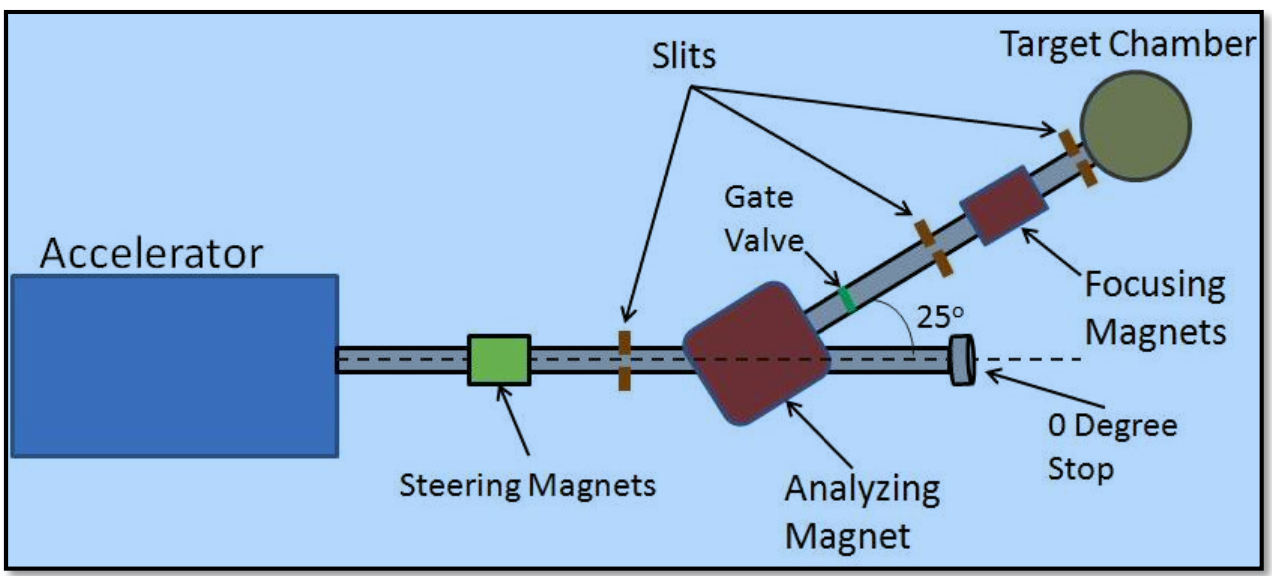
The Beam Line
After being accelerated, the protons are directed into a drift tube or beam line, which is kept under high vacuum conditions using two sets of specialized vacuum pumps. A controllable steering magnet is strategically placed midway along the path to ensure the protons are accurately guided toward the target chamber. This magnet generates a uniform magnetic field and utilizes the Lorentz force to steer the protons based on their mass and energy.
Once the proton beam successfully passes through a narrow slit, it proceeds through a series of focusing magnets. These focusing devices are quadrupole magnets, designed to create a specific magnetic field configuration that effectively ‘squeezes’ and focuses the proton beam, enhancing its precision and intensity.
(Image 3: The beam line)
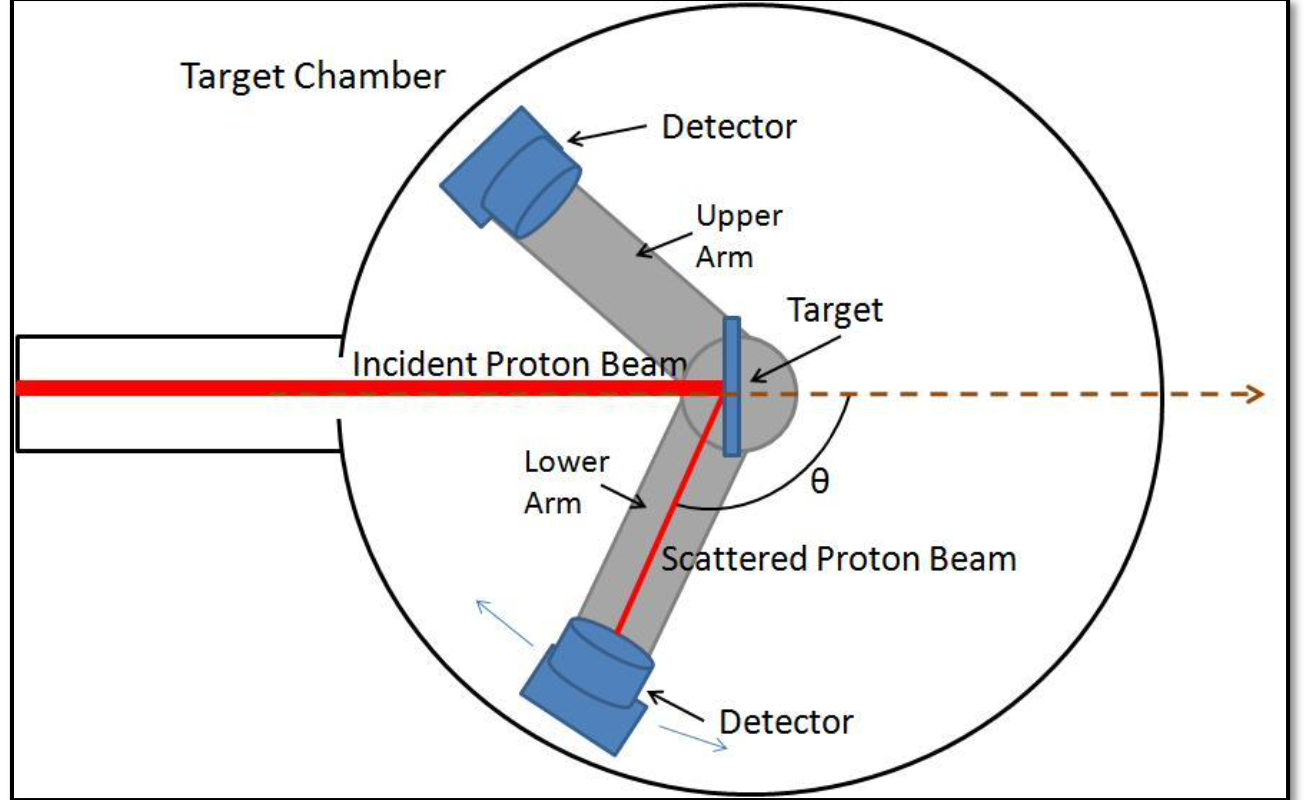
The Target Chamber and Detector
The target chamber is a cylindrical apparatus equipped with a centrally located target holder, as illustrated in Image 4. The target holder can be precisely rotated a full 360 degrees using an external knob. Additionally, the chamber features two rotatable arms, designated as the upper arm and the lower arm, each capable of supporting a detector via a detector holder. These arms can also be adjusted via exterior knobs, allowing for precise angular positioning. A scale on the chamber’s exterior provides readouts for the angles of both the arms and the target holder.
Once the protons have been guided and focused through the transmission beam line, they enter the target chamber where our silicon detector is positioned. This detector is connected to an amplifier, which serves to enhance the signals it receives. The amplified signals are then transmitted to a computer for visualization and further analysis.
(Image 4:The target chamber)

(Image 5: Beam line and target chamber)
Energy Calibration with known sources
In order to calibrate our unknown proton energy, we needed energy calibrations for known sources. In our case we used sources like Americium(Am-241), Europium(Eu-152) and Barium(Ba-131). We placed each of these elements separately in front of our detector and analyzed their energy data using the MCA(multi- channel analyzer) software. We then compared these energy peaks with that of National Nuclear Data Center, since they have all the standard energy values. We will use these energy calibrations to calibrate our proton energies after detection.
Data Collection Schematic plan
- We will take Energy data for only the silicon detector
- We have evaporated our Gold on our detector and calculated the thickness of the gold using the UV-vis method.
- We will take energy data for Gold on a silicon detector
- Take the difference in energy between the two energy data(Energy data for only silicon and that of gold and silicon).
SRIM (Stopping and Range of Ion Matter) calculation
SRIM is a software program used for calculating the transfer of ions and matter. It has a core program called TRIM(Transport of Ion in Matter). The mechanism of the TRIM is very simple. You set an element at a particular velocity(You adjust the velocity) and it goes to your target layer which you set to any width and element you want. You can also choose the type of TRIM calculation you want. In our case there will be collisions so we chose the collision step and surface sputtering option. After running the TRIM, it will give you the energy loss data. In our case we set hydrogen ion (H–) to the velocity we want, and we set the target to silicon(first) and gold on silicon(second).
We will use the SRIM calculation as the intrinsic data and convolute it with a Gaussian instrumental response and compare it with our experimental data (the proton energy loss data we took in the lab)
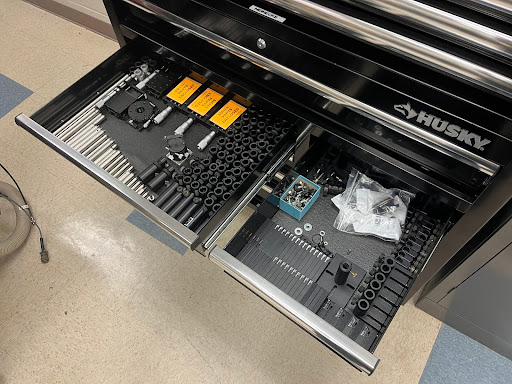
Some of the adjustments we have made so far
We utilized the ICL and 3-d printed a cover for gold evaporation to ensure precise deposition of gold and a cap to cover the detector as the beam hits. Created two new targets to enhance proton focus on the detector. We also created a new full wave rectifier and replace the old one that is part the RF oscillator in the ion plasma source which produces the protons.

(Image 6: new full wave rectifier.)
Some of the challenges we have faced so far
Our work was not immune to unforeseen troubles-from accidentally damaging the ion source bottle to the plasma not striking, our lab experienced a fair deal of challenges. In order to accomplish the daunting task of changing the rubber belt, we had to dismantle the entire accelerator. Despite our precautions, we ended up breaking the ion-source bottle while putting things back together and had to replace the same. The replacement was a collaborative task that took a week , and multiple rounds to the chemistry department for cleaning and baking the bottle.

(Image 7: Broken bottle)
Once the new bottle was settled in, our next task was closing and running the accelerator. While the bottle was striking with plasma when open, there seemed to be no generation of plasma once closed-this problem took approximately 2 weeks to resolve- explain fixes. Tightening transmission lines, refilling hydrogen bottle, And carefully shortening thewire connecting adjustable capacitors-all these little tasks helped us overcome this problem.

(Image 8:Plasma striking)
Current Tasks
The accelerator is now running as expected, so we have begun taking energy data and look forward to analyzing more peaks in the upcoming weeks.