Worms, Museums, and More Worms

This year, the Genetics Society of America held its 24th International C. elegans Conference in Glasgow, Scotland; so Professor Powell and two of her lab students (Noah and Isabella) packed up their bagpipes, donned their kilts, and made their way to Glasgow! All jokes aside, we made up some awesome fabric posters that we could pack in our carry-on bags and flew across the sea, making a quick pit stop in Reykjavík before finally landing in Scotland. We arrived about a day and a half before the conference officially started, so we set off to explore Glasgow (after Noah and Isabella fueled up on some much needed coffee). 

Our first stop in Glasgow was the Hunterian Museum at Glasgow University. To reach our destination, the adventurers three passed through Kelvingrove park. Interestingly, the park and many locations throughout Glasgow are named after Lord Kelvin, best known for the creation of the Kelvin unit of measurement. As the first stop on the trip, the Hunterian was a pleasant surprise, as their collection contained a larger selection of Roman artifacts from the Antonine Wall, a variety of fossils, and a plethora of objects from the personal collection of John Hunter, the gallery’s namesake. But the highlight of our Scotland sightseeing was the Kelvingrove museum the next day. There we were able to see their large collection of taxidermied animals and artwork, including a performance from the museum’s organ. However, we were not able to see the whole museum, as the conference was to start later that day. Here are some pictures taken along the way: 

Finally, it was time for the conference to begin. We freshened up after our morning of walking before heading to the conference center. One of the buildings making up the conference center was referred to as “The Armadillo” due to it’s shape. Here’s a picture from our walk to the conference center and us in front of the Armadillo before the first plenary session: 

With the first round of plenary sessions, most of the talks were geared towards a more general C. elegans audience, not catered to any one specific area of focus. But the session did feature a talk by Julie Ahringer on how different genomic factors are able to direct development in worms. Julie Ahringer is a professor of genetics and genomics at the University of Cambridge; and her lab pioneered genome-wide RNAi screening, resulting in the widely-used C. elegans RNAi feeding library.1 

The second day of the conference is when it started in earnest though. Normally, each day of the Worm Conference was divided across different subject oriented talks, workshops, and plenary sessions. But each day of the conference would always start with several topic specific talk sessions. The three of us decided to take a “divide and conquer” approach to the first session of the second day; with Isabella and Dr. Powell attending the talks focusing on RNAi, and Noah going to the session about worm morphology. 

We reconvened for lunch and the rest of the day’s sessions, which consisted of workshops discussing different methods for imaging various phenomena in worms, as well as plenary talks focusing on germline gene expression and kin recognition. Then it was time for our first poster session of the conference. This was truly an eye-opening experience. Those who were to present posters at the conference had been split into groups A, B, and C, which would determine which day of the conference they would present their posters on. Those groups were further divided into even and odd numbers that would determine which hour of the poster session they would be required to actively be present at their poster. Even so, there were easily 200 poster presenters on the first day alone. 200 C. elegans scientists presenting their research to even more fellow worm researchers all in one big room – it was quite chaotic, to say the least. Nevertheless, we split up, attempted to gain our bearings, and sought out posters we were most interested in learning more about from the abstracts we could read on the handy conference mobile app. Even still, despite the chaos we were able to visit the poster by the Curran lab on different phenotypes induced by SKN-1 activation (something we talk a lot about in the Powell lab!). 

There was no way we could truly see every poster, but another important part of the poster session was the worm art show. The worm art show featured works of art ranging from paintings, textile crafts, and 3D printed objects all created by researchers at the conference. There was a truly amazing re-imagining of Michaelangelo’s The Creation of Adam named The Creation of C. elegans, featuring the Sydney Brenner – who pioneered the use of C. elegans as a model system for human disease research. There was also a spread of worm themed tarot cards; a model of a worm, complete with its intestines, gonad arms, and eggs, all made of wool; and many more creative worm related artworks. 

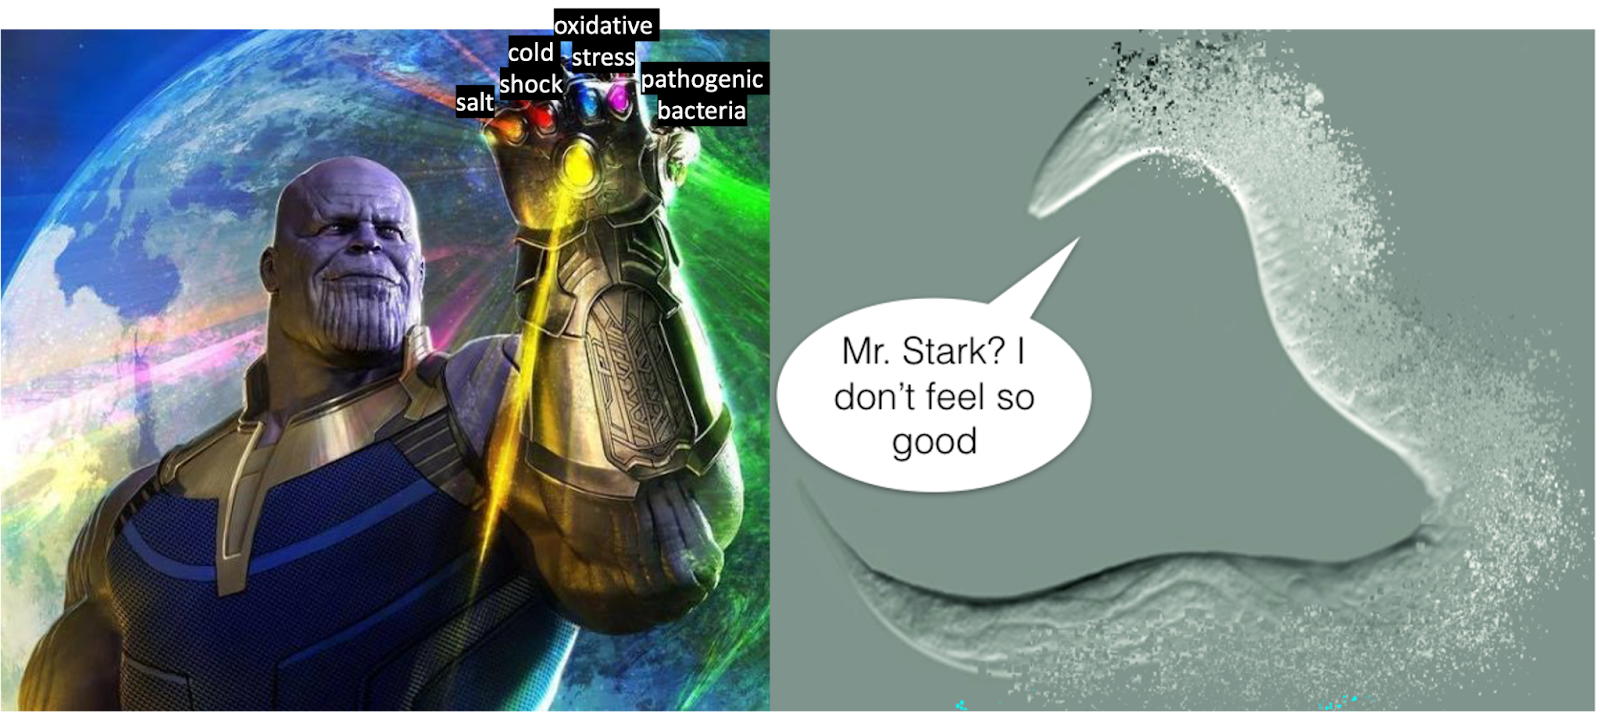
After our first poster session, it was time to grab some dinner and head back to the hotel. Then we did it all again the next day and the day after that! We heard so many more interesting talks, ranging from aging and stress to microbiomes to imaging tools, etc. etc. While the whole conference consisted of worm research, the third day of the conference was the most prevalent to our own research, as much of the talks focused on how stress affects C. elegans. As such, many talks revolved around how reactive oxygen species (ROS) induce different behaviors, factors affecting worm memory, and regulation of various intestinal mechanisms. Like the day before, it was capped off with another poster session. However, now that we knew how to navigate the space, we were able to visit more posters than we previously were. Again, we decided to split up to cover as many posters as possible. In doing so, Noah attended posters presenting on cold stress and aging in worms, and Isabella went to posters on pathogen related stress in C. elegans

 On the last full day of the conference, Noah and Isabella were up to present their posters. They got the chance to talk to lots of folks about the research they’ve been doing here in Gettysburg. After their required hour of presenting, they could relax and wander around the other posters at the day’s session. Here’s Noah and Isabella with their posters: 

Then the conference was coming to a close, and what else marks the end of an event like a good old dance party? All the conference attendees made their way to Merchant Square where we were greeted outside with an authentic bagpiper! Inside we found a bunch of different food options and once everyone was settled, we were treated with some live Scottish music and dancing. Our fellow worm people then danced the night away before we made our way home the following day (although Professor Powell stayed behind to do some exploring of the highlands.) Here’s a few more pictures from our time in Glasgow:

Thanks for reading! 

To Call, or Not To Call, That is the Question

In a previous study with hourglass treefrogs, Dendropsophus ebraccatus, and túngara frogs, Engystomops pustulosus, Dr. Trillo demonstrated that nearby signalers of an attractive species, such as túngara frogs, can drastically alter the risks of attracting eavesdropping parasites to less attractive species, such as hourglass treefrogs– a phenomenon called ‘collateral damage’. This summer we are especially focusing on calling behavior changes and spatial shifts in hourglass treefrogs in response to calling túngara frog neighbors.  

To investigate changes in calling behavior of hourglass treefrogs due to the identity of their calling neighbors, we are carrying out three different experiments that examine the calling behavior and dispersion of hourglass treefrogs both spatially (vertically and horizontally) as well as temporally: 

(1) AudioMoth recordings: To understand the natural calling behavior of hourglass treefrogs and túngara frogs in Gamboa ponds, we placed sound recorders called AudioMoth in two different locations where the two species are known to call in mixed-choruses. We retrieve the AudioMoths every other night and note the species present at the time of collection. Recordings from these AudioMoths give us information as to where, and when these species are calling from, demonstrating that the two species can be present and active at the same time. 

(2) Acoustic camera recordings: The acoustic camera is a device equipped with both visible light and infrared cameras as well as an array of microphones. The circular array of microphones surrounds the camera and is sensitive to a broad range of sound frequencies.  Combining information from the microphone array and the infrared camera can help us pinpoint the location of calling frogs, and give us information about when sounds are made, how frequently they occur, and their amplitude. We record the output of the acoustic camera onto a laptop computer for future analysis. In our experiment, this camera is used to track hourglass treefrog calls and the location of those calls in the presence and absence of a túngara playback.  

To conduct this experiment, we find a focal male hourglass treefrog In a pond and set up two tripods around him: one with a speaker about a meter away, and one with the acoustic camera four meters away. There are two different treatments: No playback, and túngara playback. No-playback trials consist of five minutes of adjustment time, followed by five minutes of recording, and then three additional recordings every five minutes. This treatment helps us get a baseline of hourglass treefrog calling behavior in the absence of nearby túngaras. Playback trials have the same five minutes of adjustment time and five minutes of recording, but then at the start of the second recording, a túngara call is played from the speaker every second for the final three recordings. After the trials are over, fly strips are placed on the speaker and a five-minute túngara playback is played. This is done to give us an idea of the number of parasitic flies present that night. As this part of the experiment is done in a natural setting, it gives us an idea of whether hourglass treefrogs change their behavior in response to the presence of túngara calls, whether that be the timing of calls, types of calls, or movement of the focal individuals. 

The left is an example of what we see when the frog calls, a red circle will emit from its location indicating a high frequency. A deep red means loud noise, and the scale falls down to a light blue which indicates the opposite.  

We live and do our research right by the Panama Canal in a town called Gamboa. This area has a clear US influence due to the history of the US in the Canal and many US citizens previously associated with the canal still live here. Gamboa is a quiet small town next to the Soberania National Park where many STRI temporary or long-term researchers as well as staff scientitsts live. This is not only because of the quick access to Soberania National Park and because this habitat attracts researchers around the globe, but also because we are next to Barro Colorado Island, one of the most important sites for tropical biology research in the world, and to one of the largest STRI owned laboratories in Panama.  

My Panamá journey has been a series of first times. On the first day, I took a plane by myself for the first time, used my passport for the first time, and settled into an apartment for the first time. During this trip I saw many tropical animals for the first time. For example, the first morning here I saw a family of agoutis, which are large rodents with a face similar to capybara. I’ve also learned a lot about katydid insects thanks to our postdoctoral fellow, Ciara. A lot of her Ph.D. work is centered on them. The wildlife here never ceases to amaze me. One night on a hiking trail, we stood in amazement staring at a tarantula on a tree. On another day I saw a beautiful toucan right above me in a tree while I was walking from STRI to my apartment. I also see monkeys all the time. I have seen white-faced capuchins, tamarins, and howlers. I could go on forever about all the different tree frogs I see: my favorite are gladiator frogs.  

The wildlife is not the only amazing thing in Panamá though. I’ve met a lot of passionate researchers and been inspired by their projects. In June our team went to a Fellow’s Symposium at Tupper Auditorium. I watched project presentations in awe and later got to talk with the researchers. That is how I met staff scientist Sabrina Amador. She was so encouraging and invited me to visit her interns in the lab. They thoroughly explained the mutualistic relationship between ants and fungi and described parasitic behavior while they showed me their colonies. I also went into the field with them to check on their alate ant traps and to determine the health of the marked colonies. I encountered more researchers at Barro Colorado Island, where I watched a fascinating talk on frog partitioning in the various frequencies of their environment which I got to relate to the project we are doing. I’ve been faced with many opportunities here to further explore my interests and discover new ones and made connections that open up so many different paths.   

I came to Panamá for my first internship and have gained a lot of tropical field experience and knowledge, but I’ve also had time for other fun activities. Our team went to a pride festival where we got close with other people from STRI and met some friendly Panamanian people. During the march, I got to see gorgeous views of Panama City and the Pacific Ocean. It was my first time seeing the Pacific Ocean. Afterward, we went out to eat good Mexican food. The best food I have had here though was on my birthday after seeing Barbie in theaters with Arden, Michael, and Alex. We went to a restaurant called Tantalo in an area of Panama called Casco Viejo, where we ordered duck, salmon, octopus, brussel sprouts, salad, and beef sliders. I think about that meal daily. Another activity I enjoy is practicing my Spanish with native speakers. I  get to practice my Spanish whenever I order lunch meat at the grocery store or when I go to STRI’s get-togethers with other researchers. All these moments are special to me. I could not possibly fit every meaningful experience I’ve had in Panamá into this blog. I’ve had such priceless interactions here and gained so much knowledge! 

Here in Gamboa, every day is different, living in a town where curiosity is fostered by amazing locals and scientists of every caliber, leading to many different activities, interactions, and opportunities – and none of that includes the amazing wildlife that lives here! (I mean, we have 20 agouties as neighbors, see monkeys daily, chase frogs, and are chased by birds, what more could you want?) 

The first several weeks of our time here were spent sewing our mesocosm, driving to the city to buy supplies for our projects, and running pilot experiments in the evenings. These tests consisted of things from using a funnel for female frogs made from a plastic bowl to finding ideal sampling times, to learning how to use the acoustic camera’s technology. Now that we are more settled into a routine, the afternoon is spent exploring Panama, learning from scientists both in and out of the bat lab, and relaxing by the pool at the Gamboa Resort. The night, however, is a different story, we capture males for the mesocosm, and females for a separate experiment, wade into Kent’s marsh for acoustic camera sampling, and trek into the forest for the Audiomonths. 

​ We have had the opportunity to attend many talks in our time here at STRI. We attend weekly Frog Talks, where scientists present their research on topics ranging from frogs to katydids! We also attended the Fellows Symposium at STRI’s headquarters where we listened to some incredible presentations. The topics ranged from knitting as a way to connect with nature and to educate on the importance of science and communication, to our understanding of sharks’ roles throughout time, to trade through Panama as seen through pottery. These only give a glimpse of what we have been exposed to here at STRI, but hopefully, demonstrate the variety of interests and studies that happens here at STRI. 

​ When we aren’t in the field or auditorium, we go on day trips to explore the surrounding areas. We have seen the tropical forest in its glory on some beautiful hikes, experienced the Panama Canal, watch huge boats move through the locks, and experienced some of the nightlife as well! One of the biggest highlights of this trip for me was when I was able to join the Bat Lab on a netting trip, where we traveled to a near-by cave system to catch Phyllostomus hastatus, or the greater spear-nosed bats. They were really big, around 120 grams, and had incredibly strong wings and jaws, but at the end of the day, they really just wanted eat bananas and sleep

Recently, we had the opportunity to visit Barro Colorado Island (BCI) a STRi facility located in the Panama Canal. We were able to visit because a Bambi Talk was being held that day. Bambi Talks are similar in idea to Frog Talks, where people present their research. Before attending the talk, Tiana, Michael, and I went on a hike around the island and got to see a howler monkey troop up close along with a crested guan, and a wide variety of other taxa! After our hike, we attended a talk on the analysis of frog sound partitioning based off previous studies. 

​ There are still two weeks left here in Panama, and we are determined to make the most of it. Our research is still ongoing, and in our time off we will keep exploring Panama, and will be participating in two outreach opportunities, one with the local zoo for Golden Frog Day, and one where we will present our preliminary research to the public on bat-night! 

The (Un)silent A, B, C’s

Welcome to Fly News! I’m DinK, bringing you live updates from the notorious Alphabet City, nestled in the Left (Fly) Wing of the Science Center. This vibrant city comprises three distinct areas known as DIPstricts: A, B, and C. The residents of these DIPstricts are renowned for their inexhaustible liveliness, as demonstrated by their impressive 42 minutes and 50 seconds record of silence. While their cheerful nature is a source of amusement, it has also sparked concerns among inhabitants of neighboring lands such as The Solis and Eshelman regions. What exactly happens in this peculiar city, and what exciting activities take place within each DIPstrict to ignite such boundless enthusiasm? Today, we have mayors from each DIPstrict of Alphabet City who will provide us with an insider’s perspective on the captivating activities unfolding behind the scenes.

DIPstrict A

Greetings! I’m Y (not the abbreviation, pronounced ME without the M), and the mayor of the DIPstrict A. Dipeptidase A (DIP-A) in Drosophila melanogaster underwent the name changing process and is now proudly known as carnosine dipeptidase A, all because our human relative carnosinase called us. Well, even enzymes can have family drama.

In the human carnosinase district, carnosinemia patients face challenges due to low carnosinase activity, such as developmental delays, neurological deficits, and even seizures. On the flip side, our Drosophila residents with DIP-A deficiency struggle to survive the larval stage. Life can be tough for our tiny residents.

Talk about family resemblance! DIP-A and carnosinase share 76% similarity in their amino acid sequences. They are both dimers, made up of two subunits. The Dip-A gene produces two different versions of proteins, known as isoform A and isoform C. So, DIP-A can exist as either a homodimer (where the subunits are the same, AA and CC) or as a heterodimer (mixing it up with different subunits, AC).

To observe the presence of DIP-A and its active structures, I conducted a non-denaturing gel electrophoresis or native PAGE. This technique allows the separation of proteins in the sample without breaking them down into subunits. In combination with the Western blotting technique, where anti-DIP-A antibodies specifically detect and bind to the DIP-A protein, I aimed to identify the bands representing the presence of each protein. You’ll easily find me and the residents of DIPstrict A buzzing in the cold room since native PAGE requires low temperature. Due to the close molecular weights of the dimeric proteins, instead of neatly separated bands, residents love sticking together and end up with a big smear. I am still trying to find a better way to separate them for a good photoshoot.

I also stained the gel for DIP-A dimeric enzyme activity using a DIP-A specific substrate with an agar overlay on the gel to amplify the signal of the bands. The data I got so far from this staining technique is a smiling face (on the gel, not me). The gel is cheering me on. Who knows what other surprises await me in the cold room? 

Mayor Y is in her office and getting cold. Someone locked the door and she is stuck inside.

DIPstrict B

Hey! I’m Mayor Van Dinh (not to be mistaken by DinK) and welcome to DIPstrict B, a vibrant and bustling neighborhood within the genomic metropolis! DIPstrict B, aka the “Splice Street,” is where all the action happens, with dipeptidase B (DIP-B) stealing the spotlight. In the heart of DIPstrict B, we encounter the charismatic Drosophila Dip-B gene. It’s the lifeblood of this neighborhood, producing multiple mRNA isoforms that come in different flavors. We have Isoform A, Isoform B, Isoform C, Isoform D and Isoforms A/C and E, who hide intriguing secrets beneath their varying 5′ UTR lengths. They are the colorful characters shaping the genetic landscape of this district! Just as a neighborhood’s streets have diverse architectural styles, these mRNA isoforms showcase unique splicing patterns. The translated regions remain consistent, much like the beautifully designed buildings, while the 5′ UTR acts as the entrance, with each isoform having its own distinct length.

mRNA Isoforms of Dip-B Gene. Dark green areas represent exons (coding sequences), light green represents untranslated regions (UTR), and horizontal lines represent genomic DNA that are not in mRNA.

To shed light on this intriguing genetic neighborhood, residents are embarking on comparative studies to understand the relative proportions of these Dip-B mRNA isoforms. They are using RT-qPCR to quantitatively measure the mRNA isoform levels. This investigation will provide insight into how alternative splicing patterns in the 5′ UTR region influence gene expression, much like unraveling the secrets behind hidden passages in a neighborhood. Just as a neighborhood evolves over time, gene expression levels can fluctuate during different developmental stages.

Metamorphic Life Cycle of Drosophila melanogaster. Red arrows indicate stages investigated.

By analyzing the occurrence and proportion of mRNA isoforms in various growth phases of D. melanogaster, residents can witness the genetic neighborhood transform. It’s like observing a neighborhood’s architecture adapting to the changing tastes and needs of its residents.

Amplification plot from an RT qPCR experiment comparing presence of isoform A vs isoform E. Calculated Ct (cycle threshold) values show that isoform A is expressed more abundantly than isoform E overall.

Understanding the intricate relationship between splicing patterns within the 5′ UTR region and transcription levels of mRNA isoforms opens a gateway to comprehend the significance of alternative gene expression. These findings could illuminate molecular mechanisms and mutations, aiding in the identification of potential therapeutic targets for human diseases such as Alzhiemers and Crohn’s. Just like how understanding a neighborhood’s dynamics helps create a better living environment, deciphering gene expression intricacies can contribute to improved health outcomes. 

As you bid farewell to the lively streets of DIPstrict B, I hope you were able to witness the marvels of alternative mRNA isoforms and their impact on gene expression. This metaphorical journey through a genetic neighborhood has shown us that exploring the world of dipeptidase genes is not just about molecules and DNA but a captivating exploration of hidden stories and secrets within. As you go along your journey of discovering the great activities within each DIPstrict within Alphabet City, I hope that we can continue to unveil the wonders within DIPstrict B and unlock the mysteries of gene expression, one splice at a time! 

Mayor Van caught napping in the lab. Van likes dogs, food, and naps.

DIPstrict C

DIPstrict C runs a Xaa-Pro treatment plant where dipeptidase C (DIP-C, a prolidase) in Drosophila melanogaster breaks down the bonds between the two amino acids. It is a relative of the PEPD (protein PEPD) in the human town, who runs a similar plant. The PEPD plant is essential in maintaining the overall fitness of the human, specifically protein metabolism, collagen turnover, and extracellular matrix remodeling, and hence involved in wound healing, inflammation, angiogenesis, cell proliferation, and carcinogenesis. If PEPD went on strike, humans would suffer from dysmorphia, developmental delays, and impaired wound healing. However, overtime working at the plant is observed in Alzheimer’s disease and associated with several types of cancer such as bladder cancer, breast cancer, and pancreatic cancer. 

In DIPstrict C, there are two structures (mRNA isoforms), called A and B. The two are almost identical except that mRNA isoform A is 204 bp shorter than mRNA isoform B at 5’ UTR. Regardless, they are both owned by one guy (protein) called DIP-C.

Previous residents have found that structure A is more common than structure B. Since Drosophila melanogaster is a metamorphic organism, their genetics can differ greatly across developmental stages. This led me to wonder if the proportion of structures vary at different developmental stages. Is A or B more common, or are they equal in number? To find out more about this, I, Mayor Vy, use RT-qPCR (reverse transcriptase quantitative PCR), a technique that allows me to quickly and accurately quantify the proportion of the structures in the region. Total RNA from samples have been collected, RT-qPCR has been conducted, and analysis is under way.  

Comparison of standardized total Dip-C mRNA (both isoform A and isoform B) among developmental stages. One-way ANOVA revealed significant differences between developmental stages (p<0.0001). Larval stage (L) expresses more Dip-C mRNA than adults (F = female, M = male) and pupal stage (P) expresses the lowest level of the transcript relative to total mRNA in samples.

Visitors wonder about the underlying reason for the disproportion of the two structures. Therefore, I’m also doing bioinformatic sequence analysis of the structures. Our two major suggestions are: (1) structure (mRNA isoform) A is more beautiful (better promoter) and (2) structure A is more stable. 

For (1), I have been searching through the Drosophila Housing Beauty Standards aka Drosophila Promoter Database that reported features that were reported as attractive in housing from 205 samples (205 promoters). None of them match exactly. This actually might not be surprising, since the database surveyed only 205 structures (genes) out of more than 13,000 of the Drosophila genome. As for (2), I am still evaluating blueprints on how to effectively and easily examine the stability of the structures.  

— 

The information above was compiled by the Mayor of DIPstrict C, Vy. Vy loves DIP-C, cats, pandas, flies not flying, sleeping at midday not midnight, and eating two dinners a day. If you want to see more works from Vy, please donate lots of love, RNAse-free tips and a new comfortable hammock.


As more activities are sure to develop within these DIPstricts, Fly News will be the first to report to you with more live updates. Reporter DinK signing off.

DIPstrict mayors council meeting (aka Hiraizumi Lab)

“It’s Lit!” – Making Proteins Glow

Hey there, welcome to the Kittelberger lab! This summer we are working to develop the Cell Biology lab curriculum at Gettysburg College by allowing students to manipulate glowing proteins in cancer cells. The current Cell Bio lab includes an independent project where students use chemotherapy drugs to see the effects on overall cell growth or death. Our goal is to make specific proteins glow fluorescently within these cells so that students can manipulate them on a subcellular level. Rather than just seeing the cells microscopically, they will be able to see the fluorescent proteins within. Targeting specific glowing proteins rather than whole cells opens up a range of new experiment options that students can choose from and allows them to be more creative. Our research will give them a better learning experience as they will be able to visualize intracellular components and create more complex independent projects connecting lecture material to the lab.

Meet The Crew:

This is Dr. Kittelberger. We’re not going to make fun of him because we all need letters of recommendation.

This is Krissy. She’s the grandmother of the lab, in bed by 10pm every night. She doesn’t like the days spent in front of our computers, can’t do all this technology stuff

This is Jehan. He’s the voice of reason and a high-functioning lab tech. Please contact modyje01@gettysburg.edu for all of your lab tech needs. 

This is Alessandro. He’s the annoying little brother that Krissy never had. The two of them are constantly bickering. 

This is Natalie. She’s the freshie of the lab. She likes to smile and nod and keeps her distance from all the bickering.

How to Make Proteins Glow

Visualizing fluorescent proteins requires that a given protein is indeed glowing. There are a variety of methods by which one can fluorescently label proteins–such as with antibodies as well as fusion proteins.

Fusion proteins, like antibodies, can be attached to a fluorescent tag that will glow under suitable conditions. However, the tag utilized in fusion proteins differs fundamentally from that which is used in antibodies. As the name suggests, a fusion protein is a protein that is fused to a fluorescent protein (in this context), whereas the antibodies utilized this summer are attached to a fluorescent molecule. The discovery of the first fluorescent proteins was made in the 1960s, and 30 years later, these proteins were cloned and have since found a plethora of applications owed to their fluorescent properties. 

To express the fluorescent fusion proteins in vitro, we utilize the central dogma, in which DNA is transcribed into RNA that is translated into a protein. In this context, this process predicates the need for DNA that encodes a protein of interest fused to a fluorescent protein. This is often achieved with a plasmid (circular, extrachromosomal DNA that can replicate independently) raised in bacteria. Essentially, one can grow a bacterial culture containing an engineered plasmid, extract the DNA, and transfect cultured cells. 

DNA transfection, or the process of getting plasmid DNA into target cells, can be achieved in multiple ways. However, the Kittelberger Lab used lipofection and electroporation to this end. Lipofection uses liposomes–which are composed of a phospholipid bilayer like the plasma membrane–to aid plasmid passage into a cell. In electroporation, the cells are placed in an electric field that creates small “pores” in the plasma membrane through which the DNA can pass. Once inside the cell, plasmids can utilize the cell’s transcription and translation machinery to produce a functional, glowing protein. Finally, we have a glowing protein.

The above images are of calnexin, which is fluorescing yellow due its fusion protein (mGold).

Along with fusion protein tagged plasmids, we also wanted to try and tag some proteins with antibodies and compare the two techniques. Antibodies are protein specific and bind to the protein of choice. When cells are stained for visualization, one exploits an antibody’s natural specificity for a given protein. Once added, antibodies will bind to and illuminate their target. We are utilizing primary antibodies for our proteins as well as secondary proteins that are fluorescently tagged and bind to our primary antibodies. When excited with the right wavelength of light, the secondary antibodies emit their own light and appear to glow. So far we have attempted antibody staining on fixed cells, cells that die in the process of fixing but retain a life-like form, making it easy to visualize them. The whole process involves fixing our cells with paraformaldehyde, using a permeabilization buffer which allows our antibodies to enter the cells, a blocking buffer which prevents nonspecific binding of the antibodies, and our antibody solutions that stain our proteins of choice. We are also trying to stain our cells on coverslips that enable us to utilize high power microscopy and observe our proteins in subcellular structures. Towards the end, we will attempt to stain live cells and potentially do some timelapse imaging to observe how our proteins behave inside cells over time and whether there are any changes in their subcellular localization.

Both of the above images are of cells in which lactose dehydrogenase (LDH) has been stained with a primary antibody targeting LDH-A and a secondary antibody fused to a fluorescent molecule (AlexaFluor 488).

How to See Glowing Proteins

Individuals behind cancer research use fluorescent probes to understand the inner workings of cancer cells. They do this by illuminating their cellular processes and understanding subcellular localizations of targeted drug treatments. In our lab we are utilizing new fluorescent microscopes (EVOSm5000) and EVOSm7000) to help quantify and visualize cultured mice melanoma cells (B16-F10 cell line) that we are staining. Before we could see all the cool stuff, we had to learn how to actually use them. For some context, each of our genes are attached to a specific fluorescent protein, these being mCherry, mGold, mVenus, or good ol’ GFP. These proteins are red, yellow, dimmer yellow, and green respectively. For each fluorescent protein, they have a specific excitation/emission ratio which we had to take into account when picking a filter cube to use. These filter cubes allow for specific wavelengths of light in, whilst removing any unwanted light source. These microscopes contain a multitude of filter cubes and the ability to use more than one at a time can give off some interesting images. Following transfection of plasmids into our cells we were able to see some glowing cells!

We are each working with a 24 well plate and for imaging purposes, we wanted to capture images in different quadrants of each well. For each image that we take, we are really taking three at a time accounting for an image using the filter cube, one in brightfield, and another merged photo. That is a whopping 288 images per day which we analyze! We imaged every 24 hours for three days as we noticed our cells begin to die around day three of imaging. 

In terms of quantifying images, we decided to manually count the number of fluorescent cells in a 10X magnification field of view and divide it by total confluence, i.e. number of total cells to get percent transfection. These microscopes have built-in image analysis tools which allow the user to select viable cells to be counted as our “standard” and use a selection tool to block out unwanted space that we didn’t want counted.

The above image is of melanoma cells that have been stained with a blue fluorescent nuclear counterstain (Hoechst 33342).

A Closer Look at One of Our Proteins

When picking genes, we selected those which had a large involvement in tumorigenesis. We focused on ATG16, MEK1, P53 and BRAF, among other proteins. Research has found that the RAS/RAF/MEK/ERK pathway, better known as MAPK pathway, is a large player in melanoma development. Key signaling molecules involved in this pathway include BRAF as well as MEK1. BRAF within this pathway is involved in cell growth and proliferation. A BRAF mutation at codon 600 where glutamic acid replaces valine accounts for nearly 50% of all malignant melanoma cases. Current treatment looks at the use of BRAF inhibitors in combination with targeted therapy for MEK proteins. When BRAF is inhibited, this causes a feedback activation of MEK, another component in the MAPK pathway. This can lead to downstream reactivation and can cause tumor growth and resistance to drug therapies. As stated, MEK1 is a small molecule within this signaling cascade which is  downstream of BRAF. It is involved in cellular processes such as cell differentiation and migration. Since it selectively binds here, this causes the phosphorylation and activation of kinases.  Therefore if there are issues early in this signaling cascade, this can follow in subsequent steps.

Thank you for checking out our progress this summer. If all goes well, we could be bringing glowing proteins to a cell biology laboratory curriculum near you.

Eddie’s Lab

“Be happy. Love being you” ~ Eddie

This is Eddie. Eddie is the manager of the personality lab and watches us to ensure we get all our work done. The lab also consists of Professor Berenson, Waverly, Fabio, and Thea.

Here are some fun facts about us!

Fabio really likes squirrels. He constantly stops to take pictures of them, even while biking.

“I love catching squirrels doing power poses” ~Fabio Lo 2023

Waverly really hopes that Fabio can teach her Portuguese in the remaining three weeks.

Thea plans to secretly evolve into a crab after graduation.

Our Research

How did that make me feel? What am I feeling right now? These are some of the questions we ask ourselves regularly. These questions are related to some of the topics we are studying this summer. Although we all have these questions, people differ in how they are able to respond to them.  In the Personality Lab we have developed a study to examine how emotion differentiation relates to self-compassion, emotion socialization, peer support preferences, and positivity culture. We aim to see how each of these topics are interrelated.  

Emotion differentiation is one’s ability to identify specifically what emotions they are feeling (Barrett et al., 2001). Emotion differentiation has since been related to the ability to make distinctions between similar emotions. Literature suggests that people’s recognition of their emotions is not a universal experience (Barrett et al.). More specifically, it has been proposed that some people are better able to differentiate their emotions than others (Smidt & Suvak, 2015). Other research has also explored several potential correlations between high emotion differentiation and healthy behaviors. This research suggests that individuals with high emotion differentiation are better able to identify their emotions and thus are more equipped to manage them (Kashdan et al., 2015). Based on Kashdan and others’ research, we hypothesize that people’s ability to differentiate their emotions will be positively correlated with self-compassion. Self-compassion is being kind and understanding towards yourself when faced with adversity, recognizing that everyone has struggles, and accepting that negative thoughts are only a part of you (Neff, 2003). 

One factor that may influence self-compassion is how accepting people are of negative thoughts. Positivity culture promotes the message that you must think positively all the time to live a good (happy, healthy, and successful) life. Positivity culture is common on social media (Goodman, 2022). For example, you may have encountered it in social media posts that emphasize manifesting positive thoughts/energies, the ‘law of attraction,’ prosperity gospel, positive affirmations, choosing happiness, etc. We hypothesize that people who are primed with positivity culture will have lower emotion differentiation and self-compassion than those who are not primed. Positivity culture teaches people to suppress their negative emotions and blame themselves for their suffering. Positivity culture is one example of negative emotion socialization. 

Emotion socialization is the social cues given to us by our caregivers and peers that teach us what is appropriate when showing emotions (Morris et al., 2007). We plan to examine the role of caregiver emotion socialization on the ability to differentiate and cope with emotions.   If a child’s negative emotions are frequently punished, minimized, or ignored by their caregiver, the child may learn to avoid, suppress, and judge their emotions rather than fully experience them, and in turn have more difficulty differentiating and effectively coping with them. We hypothesize that among young adults, the ability to differentiate emotions, self-compassion, and self-reported emotional well-being will be greater among participants who report receiving more supportive emotion socialization by their caregiver when they were growing up.  

In adolescence and adulthood, parents’ influence decreases and peers play an increasing role in emotion socialization and coping with emotions (Voile, 2010). As mental health problems have been on the rise among college students there has been increasing interest in peer support as a supplement to professional mental healthcare (Tardif & Stark, 2023). While there are many articles and books about how to be a good listener and a good friend, there is hardly any research indicating whether certain peer support strategies are better than others. When a friend comes to us with an emotional concern, should we suggest solutions? Re-direct their attention to something else? Encourage them to focus on the positives? Or just listen? We aim to determine which strategies are preferred in different scenarios and among people with different characteristics. During previous summers, X-SIG students in Professor Berenson’s lab compared the effectiveness of two kinds of peer support strategies for people high in borderline personality disorder symptoms (Nicolaou et al., 2022). Our study this summer expands this inquiry to consider a more comprehensive range of support strategies among a broader population of young adults. We also hypothesize that what type of support people prefer may differ with their personality traits, such as their ability to differentiate emotions and their self-compassion levels. For example, peer support that validates people’s emotions (expresses that the emotions are understandable and OK to have) may be more important for people with low self-compassion than for people with high self-compassion.  

It has been difficult to design our study as some of the topics we are investigating (positivity culture and peer support) do not have much pre-existing empirical literature. Without many established measures and questions, we have had to come up with our own measures, scenarios, and ways to code/analyze data based on the limited literature. For example, since there is almost no prior research on peer support preferences, we are developing a new measure that aims to cover the full range of typical peer support responses. We will use the data we collect this summer on peer support preferences to continue refining and testing our new measure in future studies. Additionally, previous work on the topic of emotion differentiation has mostly utilized intensive longitudinal methodologies, in which participants are repeatedly given a list of emotions (e.g., angry, sad, afraid, ashamed) and asked to numerically rate how strongly they are currently feeling each emotion. This method can be very time consuming because it requires enough data points on each participant to compute an Intraclass Correlation Coefficient as an index of how much the emotions tend to occur together (versus distinctly). In our study, we are adapting a more recently proposed methodology, in which emotion differentiation is measured utilizing an open-ended technique. Instead of rating a fixed list of words, participants name the emotions they are feeling at the moment. We believe that asking participants to write about their emotions is closer to how one would commonly identify their emotions on a day-to-day basis. Thus, we aim to benefit from a new and naturalistic methodology of measuring emotion differentiation to further understand the construct. 

I don’t care about spots on my apples, Leave me the birds and bees (and butterflies!), Please!

Listen to Counting Crows’ Big Yellow Taxi as you read our blog!

Hi guys! Welcome to the Ferster Lab, where my people get to study the diversity of the butterflies in Gettysburg, PA! It’s a pretty awesome lab, where lots of butterflies are spotted, plants are counted, and flowers are planted. Keep reading to see some beautiful pictures of butterflies!

Ferster Lab in one of our sites, Sherfy Garden. From left to right, Bramley, Dr. Ferster, Gabe.

But before we get to that, I want to introduce you to the Butterfly Band, the four of us who make up the Ferster lab. First off, there is me, Christopher Robin, but I often go by Chrissy. Dr. Ferster is my human. I love to wander around the greenhouse, but my most favorite activity is chewing on the garden clippers. My labmates often have to take them away from me, which is so unfair because they get to use them and I don’t. Sometimes I get a little scared of the gardening equipment and I have to be left behind on the survey days because I might scare away the butterflies.

Chrissy resting after a hard day of work!

Next, we have Dr. Ferster, our fearless leader. An ant lover at heart, she expanded to also study butterflies about 20 years ago, supposedly. I’m only 2, so this is all just what I have been told. When not thinking about butterflies, Dr. Ferster can be found snuggling with her favorite dog (me!), browsing the aisles of the local nursery (Ashcombes!), or baking her students yummy treats such as sourdough (Bramley’s favorite) and carrot cake (Gabe’s favorite). 

That brings us to Gabe, the botanist of the group. Gabe is a rising senior who loves all things plants. A Biology and Environmental Studies double major, Gabe likes to spend his free time climbing and trying out new recipes! His favorite meal he cooked this summer was vegetarian tacos.

Lastly, there is Bramley, the designated butterfly counter in the group. A rising sophomore Environmental Studies major with Biology and Data Science minors, Bramley can often be found swimming in the pool or testing out the local creameries. Contrary to popular opinion, she thinks Half Pint Creamery is superior to Mr. G’s. Her favorite flavor is the lemon blueberry swirl from Half Pint.

So what are my humans actually doing? Well, they are studying how flowering plant diversity affects the diversity and abundance of butterfly species. Flowering plant diversity is closely tied to butterfly diversity and abundance. Basically, this means they are looking at the plants present in Gettysburg that butterflies use as larval hosts, nectar sources, and refugia to hide in during their life stages.

Nectar plant and butterfly diversity study:

Once a week, on days meeting specific conditions (>75 F, <50% cloud cover, <10mph wind speed), the lab goes out to 6 sites around the Gettysburg area. Bramley walks through the sites first, looking low for the small skippers who sit in the grass and high for the swallowtails swooping through the air, as well as everywhere in between. She records each species in her notebook and also (tries) to take a picture of each in order to get verification for the field identification. They move fast, though! These pictures are then uploaded to the citizen science database, iNaturalist.com. Gabe and Dr. Ferster follow behind Bramley to identify the flowering plants. There are set paths that the lab follows through the field sites each week in order to maintain consistency. The flowering plants are then compared to the species of butterflies that have been spotted to compare how the diversity of flowering plants affects the diversity of the butterflies that they see each week in six different sites. 

They are comparing the diversity of this year to the three previous years that this lab has been collecting data. Due to the cold spring that we’ve had, they were seeing fewer flowering plants and butterflies than they typically would have seen at this time. In order to accurately compare the data they standardize our diversity data using growing degree days. Originally used for predicting corn harvest times, degree days are a measure of heat accumulation. They use the cumulative degree days in order to compare one year to the other. 

Over the last three years, we have found low diversity and abundance across all of our sites. The main butterflies we have observed have been grass-eating skippers and long-distance migratory butterflies. We are now trying to figure out why. We are counting the nectar plants and looking at larval host plant density to determine if a lack of resources is causing the decline in diversity and abundance.

Larval Host Plants:

We have also recently added a new part to the project. Fritillary butterflies are now rare. In the four years that this lab has been studying butterflies, only five fritillaries have ever been seen. I have never seen one as I get left at home, but everyone else has seen one. Part of the problem may be that the habitat is not suitable for fritillaries. Fritillaries need violets for caterpillars, nectar plants for adult food, and bunch grasses to use as protection for overwintering and summer diapause. They believe that one of these plant resources may be the limiting factor explaining the fritillary decline. To determine violet density they are taking a 2m x 2m PVC pipe square and dropping it on coordinates randomly generated by GIS in the New Jersey Brigade and Wheatfield field sites. Within that plot, they will count the number of violets and estimate the bunchgrass cover in order to determine if fritillaries in the Gettysburg National Military Park have declined due to a lack of these resources.

Great Spangled Fritillary spotted at the New Jersey Brigade field site in the Gettysburg National Military Park on June 19, 2023.

Because fritillaries only use violets (Viola spp.) as larval host plants, they might be more vulnerable to changing plant populations than other butterflies. Other species, such as the black swallowtail, eat a variety of plants within the same family (Apiaceae). Because they eat a wider variety of plants, including some non-native weeds and garden plants, black swallowtails might be more resistant to changes in plant diversity. My humans search plants for black swallowtail caterpillars weekly to see if they can determine a host preference.

Black Swallowtail Caterpillar on Bronze Fennel in the Sherfy Garden.

We also have our very own pollinator garden! Located behind the observatory, this is a place where they are wondering, “If they build it, will they (the butterflies) come?” They spend a lot of time maintaining this garden and looking for native butterfly plants to plant! We have numerous types of milkweed, Zizia auria, blue vervain, and so much more! At the moment, we have built a garden on campus, but the butterflies have not yet come en mass. This is likely due to the cold spring, so hopefully in the next few weeks, they will start coming! Also in our pollinator garden, they are conducting a feeding survey for black swallowtail and monarch caterpillars. We have dill, parsley, native Zizia, and green and bronze fennel all located near each other in the garden for black swallowtails. And an assortment of milkweeds for monarchs. Some of these plants are native, and others are not native, but the black swallowtail caterpillar will still munch on them, so they are trying to see which is the preferred food type when all are available. 

Our Pollinator Garden is located behind the Observatory. Come visit!

You can help us collect data! If you see a butterfly in Gettysburg you can upload photos to iNaturalist.com. Happy butterfly-ing!

Innate immunity vs Stressors and Pathogens

S.O.S. Calling out to anyone out there! We, the C. elegans, have been under attack by a warlord called Thananegan. For years, Thananegan has been on a mission to wipe out our population using stressors and pathogens. We are in desperate need of help to combat them and we are currently working closely with the Powell lab on the planet Earth to find defense mechanisms to protect us from Thananegan’s evil plot to further eradicate our population.

The Powell lab has been in touch with other scientists who have found three defense mechanisms that we can use to defeat the stressors and pathogens. We can upregulate infection response genes (IRGs) which create antimicrobial proteins that can help us attack the pathogens we face. We also have a great sense of smell and memory that allows us to avoid pathogens we have encountered before. Lastly, we can create an abundance of reactive oxygen species (ROS) for a short period of time to further fend off other invaders. 

As of now, scientists within the field of immunology have hypothesized that the detection of damage that is caused by the infection or pathogen within our bodies may be a way that the innate immune system initiates its defense mechanisms, and activates the immune response. There are also stressors like oxidative stress which occur normally in us when we’re infected with a pathogen that can also cause damage. Therefore, the Powell lab has come up with a hypothesis that oxidative stress can be a way for the innate immune system to activate its immune responses. 

In order to address the hypothesis the Powell Lab has, there are many research projects that are taking place in order to help us identify if oxidative stress can be a way to initiate the innate immune response’s other defense mechanisms, such as:

  1. Is oxidative stress needed to trigger the innate immune system? This project will be carried out by Isabella and Alisa and the way they address this question is by taking volunteers from the C.elegans community and infecting them with a pathogenic bacteria in the absence of oxidative stress. We then would measure the expression of IRGs using q-PCR (which is a tool that helps us determine the expression levels of these genes). We will also conduct avoidance assays where we also infect the worms with a pathogenic bacteria in the absence of oxidative stress to see if the worms will still avoid the pathogenic bacteria in the absence of oxidative stress. 
  2. The second part of the project is to determine if oxidative stress is sufficient to activate the innate immune system by subjecting worms to the chemicals that are known to induce oxidative stress in the absence of infection. Isabella and Alisa will proceed to measure the expression of the infection response genes to see if they have been upregulated upon the exposure to just oxidative stress. We will also conduct choice assays where we present an attenuated form of a pathogenic bacteria to worms in the presence or absence of a chemical known to cause oxidative stress to see if the worms will then avoid the pathogenic form of the bacteria by association of oxidative stress with the bacteria. 
  3. Sarah’s project is focusing on identifying genetic links between the oxidative stress response and the immune response. She is performing a reverse genetic screen using RNA interference (RNAi) and reverse transcription-quantitative PCR to identify novel regulators of the oxidative stress response, and then she is conducting experiments to determine if these potential regulators also regulate immune response genes. RNAi allows Sarah to suppress particular genes of interest by degrading the mRNA of the gene, preventing the expression of the gene by removing its function. qPCR then allows Sarah to quantify the expression levels of ox. stress and immune genes under these RNAi conditions. She is also excited about following up on the gene snpc-4 that she identified last summer as a potential regulator of the ox. stress response and the immune response. She is studying how the RNAi of this gene impacts the worms’ survival when they are infected. 
  4. Ward is currently trying to study how the genes fshr-1 and skn-1 interact in response to oxidative stress. He is using the fluorescence microscope to track nuclear localization of the skn-1 coded protein, which was tagged with a Green Fluorescence Protein in the strain ldIs7. By studying our worm volunteers put on plates made with or without sodium arsenite (a known cause of oxidative stress), he can see if there is more obvious fluorescence in the nuclei of our intestinal cells when in the presence of sodium arsenite. Then, Ward will be able to see if fshr-1 regulates the nuclear localization of skn-1 by using RNAi to knock out the expression of fshr-1 in some of our volunteers, and studying them again to see if nuclear localization still happens. This will hopefully give us a better idea of how the genetic pathways related to the oxidative stress response work.

However, the Powell lab also looks at other stressors such as osmotic stress and cold stress that Thenanegan has been using to destroy us. They are trying to figure out the types of innate immune responses that occur when we are exposed to these types of stressors. 

In a similar way to how worms are affected by oxidative stress, C. elegans also react to cold stress in specific ways. Previously, the Powell lab had shown that worms lose much of their pigmentation when young adult C. elegans are subjected to a cold shock of 2°C for four hours.

N2 worm:

Cold stressed N2:

Through using a fluorescent staining protocol, it was shown that this clearing phenotype seemed to be due to a movement of intestinal lipids into the germline and embryos of stressed worms. The embryos of these cold stressed parental worms were also shown to possess resistance to a subsequent cold shock whereas embryos from unstressed parents would normally die. However, this induced resistance often comes at a cost of the parental worm’s health, as the cold stressed young adult worms die shortly after laying their resistant embryos. This process is thus referred to as “terminal investment” and has become a subject of interest in the lab.

Recently, our primary focus of investigating cold stress is to further identify and characterize the genes that control and regulate the cold stress induced terminal investment behavior. Previously the Powell lab had shown that the gene skn-1 played a role in regulating the lipid reallocation, as a mutation causing a hyper-activation of skn-1 (lax-188) blocked worms from localizing intestinal lipids into their embryos. This behavior then allowed the lax-188 mutant worms to survive the cold stress, but their progeny did not. This led us to believe that the master stress regulating transcription factor, skn-1, would prevent cold stress induced terminal investment. However, recent papers showing that older lax-188 mutants undergo a similar clearing phenotype made us curious to revisit how the gain-of-function skn-1 mutation would affect the survival of progeny from older worms. So far, we have shown that progeny from older lax-188 mutants do survive a cold stress more so than the embryos from older wildtype N2 worms. Nonetheless, additional controls still need to be run in order to identify the specific cause of this increased cold stress resistance. 

Although there are many dark days that we experience under the attacks of Thenegan we find time to make happy moments such as telling each other riddles and jokes like the ones listed below:  

  1. What sound does the spliceosome make when cutting up the intron and exon apart?
    1. SnRP SnRP…
  2. What is tRNA MET used in initiation of translation favorite month?
    1. August 
  3. If the chromosome was an animal what would it be?
    1. ORCs  (Origin replication complex)
  4. Why did the tRNA and amino acid never divorce?
    1.  Because their couple’s therapist (amino acetyl synthetase) makes them realize they have a spark through charging 
  5. Why did Poly A Polymerase and nascent RNA get expelled from school?
    1. Because Poly A polymerase was caught adding As to nascent RNA transcript 
  6. Why does the double stranded RNA always get injured?
    1. Because it’s such a RISC taker 
  7. Which part of the chromosome is always hung over?
    1. Telomere 
  8. What is B DNA’s favorite sport?
    1. Swimming (since its most commonly found in aqueous solutions)
  9. Why is DNA such a happy molecule?
    1. Because it runs toward positivity 
  10. Why does DNA pol 3 have trouble getting things done on time?
    1. It’s not known to be processive (processivity not good)
  11. Whenever DNA is under stress, who’s always there to alleviate their stress?
    1. Topoisomerase 
  12. Why do recessive alleles have a low divorce rate?
    1. They fit the complementation test
  13. Why do seedless watermelons never become grandparents?
    1. Their offsprings are aneuploidy 

PCR: “Polymerase Chain Reaction” or “People Causing a Ruckus”?

Welcome to the Eshelman Lab!

Our lab is studying the RNA-binding protein, Tristetraprolin (TTP), which is encoded by the Zfp36 gene. We are investigating the role and regulation of TTP in the cells that line the intestines. In these cells, TTP can both prevent colon cancer and aggravate inflammatory bowel disease. Therefore, we are diving into the cellular and molecular biology surrounding this important protein to better understand how we could potentially harness this protein to prevent both diseases. Meet the inaugural members of the Eshelman Lab and hear more about their exciting projects below!

Pictured from left to right: Makiah, Bryn, Ankit

Ankit

Rising Junior

BMB major – Data Sciences minor

Greatest accomplishment this summer: Created giant used pipet tip tower

My research is to study the role of Wnt signaling in regulating the expression of the Zfp36 gene. Wnt signaling is an important transduction pathway that regulates crucial cellular processes. As it is one of the key components regulating development and stemness, it has also been found to be tightly associated with cancer. High Wnt signaling activity is found to promote colon cancer cell proliferation. It is also known that low TTP expressions can cause colon cancer. Preliminary data suggests that Wnt signaling regulates Zfp36 gene expression, however the relationship has not been explored in depth. Therefore, our research aims to investigate whether high Wnt signaling causes lowered TTP expression and clarify the mechanism by which it does this.

A restriction digest run to see if we had the correct plasmid

Two methods are being used to address this: First, is to measure the RNA levels of TTP in response to Wnt. To do this, cells were treated with Wnt-conditioned media and TTP expression was measured using qPCR. Second, I generated a luciferase reporter that is controlled by the TTP promoter. This method provides a sensitive way to measure transcriptional activity at the TTP promoter in response to Wnt and ultimately determine the genetic elements in the promoter that Wnt functions through.

A bacterial culture grown during plasmid prep

Another aspect of my research also focuses on studying the Wnt signaling pathway. With traditional methods, Wnt signaling, which is hyperactive in colon cancer, can be reduced, but this is not an immediate effect. It may take several days to observe a strong reduction in activity of the pathway. We have devised a system using CRISPR gene editing to rapidly degrade the transcriptional mediator of the Wnt pathway, β-catenin. Studying Wnt in this manner allows us to investigate, in great depth and detail, the mechanism by which it regulates TTP.


Bryn

Rising Senior

Health Sciences & Public Policy double major

Greatest Enemy: The Nanodrop

A mouse intestinal organoid

My research studies the role of TTP in intestinal stem cell proliferation and differentiation. I’m using mouse intestinal organoids to study TTP and its effects on differentiated cell phenotypes. Our preliminary findings have indicated that there is an increase in goblet cells in the absence of TTP. My research is studying how the absence of TTP influences the characteristics of the intestinal epithelium. Previous studies have shown that TTP is silenced in >75% of cancers, so I am studying TTP’s role in the intestine to better understand its role in maintaining homeostasis. By understanding its role in homeostasis, we can also understand its role in pathologies such as inflammatory bowel disease (IBD) and colon cancer. I am transfecting a fluorescent reporter into my organoids so that I can visualize TTP expression. The system that I am using can also be treated with a specific reagent to generate a rapid knockout of TTP function. This allows for a direct comparison of cell characteristics with and without TTP. I also will be looking at the RNA levels within organoids with and without TTP. This will give us insight into variable gene expression within the organoids.


Makiah

Rising Junior

Biology major – Neuroscience minor

Weakness: Extremely injury prone

A picture of HCT116 cells transfected with green flourescent protein (GFP)

My research has been looking into the protein Tristetraprolin (TTP), and how it affects intestinal permeability, which is crucial in holding together the barrier of the intestine and preventing the spread of colon cancer, and I have been working with HCT116 colon cancer cells.

One of the lab techniques I’ve been using is an intestinal permeability assay that uses a special trans-well plate that allows us to put FITC-dextran, a fluorescent sugar, on top of the cells and measure how much seeps through the cell junctions into the lower chamber. Using this, we test the permeability of the cells in which TTP was induced compared to control cells without TTP induction.

A (very colorful) set up of a miniprep to isolate DNA from our bacteria cultures

Another technique is a scratch assay to measure wound healing. I got to use a super cool new microscope that incubates the cells while you are using the microscope, and it also can take pictures of the cells. We set up a 24-hour time lapse to measure the movement of the cells back into the wound.

Like Ankit, I am also using CRISPR to create a new cell line. These cells are designed to tag TTP with a green fluorescent protein so that the cells with TTP can be visualized under the microscope. Additionally, using this line we can rapidly degrade TTP. This tool allows us to manipulate TTP within the colon cancer cells and study its role in cell growth, barrier function, migration, and invasion.


This summer, we have also really enjoyed joining the Solis Lab every week for Journal Club!

Some of highlights of things our lab members have found to do this summer outside of lab:

Exploring Devil’s Den together (where we almost lost Ankit), X-SIG hike, Bowling, Farmers Market, Sunrise/sunset runs on the battlefield, Ice cream with friends, Frisbee together while waiting for a gel to run, Beach Volleyball, Roller skating, Cooking, Swimming at Pine Grove Furnace, Buffalo Wild Wings, MCAT modules (apparently Bryn enjoys these), Hershey Park, watching T.V., and Mini Golf!!

We went mini golfing this week to settle a bet between Bryn and Dr. Eshelman over who would win!

  • Dr. Eshelman scored the only hole in one, although Bryn will argue he was robbed of two.
  • Ankit came from behind and surprised us all, for calling it a ‘golf stick’ for most of the summer, we were impressed by his skills.
  • Makiah suffered crushing defeat on hole 8 after missing the same shot 5 times.

In the end… there was a tie between Dr. Eshelman and Bryn at 58 points! (but they were both over par by 13 😉)

Bonus Fun Facts:

Our go to lab playlist is Disney songs!

We have a lab “pet” named Mr. Mango! Here he is enjoying the view out the window in our lab.

It turns out that PCR, a technique we have all used (now successfully) for our projects to amplify DNA for CRISPR and measure RNA levels, is trickier than it seems!

Super Fantastic Golden Graham Nanorods!

The Lab Members:

Professor Thompson

I’m supposedly in charge of the nanolab but often I feel like I have no idea what I’m doing. I guess that’s part of doing research, right? I’m lucky to have three wonderful students working with me this summer and you’ll get to hear a little about their work below.

Isaiah Lares

Hi! My name is Isaiah. I am a rising sophomore pursuing a physics and chemistry major. I am working on a project in Professor Thompson’s lab about how changing the supporting cation of a polymer affects polymer adsorption.

Ziang Wang

Hi! I am Ziang. I am a rising senior, chemistry major and math minor. Me and Hana are working on understanding and finding ways to control gold nanorods assembly by using pH-responsive polyelectrolytes. Confusing right? Let us break it down for you!

Hana Konno

Hi! My name is Hana. I am a rising sophomore and a chemistry major. I love traveling and visiting new places. This summer, I am working on a project with my lab partner Ziang in Professor Thompson’s lab (AKA the Nanolab). We have been synthesizing a lot of cool nanorods in the lab, so we will explain some of it down below!

What is the NANOlab about?

If you were unsure, our lab researches gold nanoparticles, hence the name, NANOlab. Research into nanomaterials has been heightened in the last couple of decades as nanomaterials exhibit unique properties that are typically not found in the regular material. There has been a lot of interest in researching gold nanoparticles for potential uses in drug delivery, biosensors, and solar technology to list a few. 

One of the projects in the NANOlab this summer is to document the effects of pH on the self-assembly of gold nanorods. This project is being done by us (Ziang and Hana). Controlling the assembly of nanorods is important because the applications of gold nanorods requires an efficient way to assemble nanorods as needed. 

I (Isaiah) am conducting the other project being in done in the NANOlab which is to quantitatively analyze the affects of changing the supporting cation of a polymer on adsorption onto gold nanoparticles. This will help us gain insight to the range of electrostatic interactions between gold nanoparticles and applied ligands.

How do we synthesize gold nanorods?

Schematic representation of nanorods synthesis. (Picture of “rainbow” at the end.)

In our lab, we use a two-step method to synthesize gold nanorods. The first step creates a seed solution with all the nanoparticles being spherical. The second step is the growth phase, where the spherical nanoparticles are grown longer. By varying the amount of AgNO3 in the growth solution, we can control the length of the nanorods that are synthesized. We decided to add five different amounts of AgNO3 ranging from 10 µL to 100 µL. The resulting rod solutions show color transition from pink to tan, which we call “rainbow”!

What do we do after the gold nanorods are synthesized?

We first clean our nanorod samples! Because excess CTAB and other polyelectrolytes sitting in the solution for a long time will change the shape of our nanorods. Therefore, we need to clean the nanorods after each coating.

The inside of our centrifuge with some of our nanorod samples.

After the cleaning, we coat them with polyelectrolytes (charged polymers)! The method we use is called layer-by-layer (LbL). As you remember from our synthesis of rod solutions, we used CTAB, so the nanorods are coated with CTAB. Since CTAB is positively charged, we can add negatively charged polyelectrolytes to the solution; the opposite charges naturally attract each other, thus the negative polyelectrolytes will wrap around the gold nanorods. (We use four different negatively charged polyelectrolytes.) The rod solution is cleaned in this step as well to remove the excess polyelectrolytes. Then, we coat the rods (now negatively charged) with pH-responsive positively charged polyelectrolytes.

Polymer coating illustration. The blue layer is the negative polyelectrolytes, the black layer is the positive polyelectrolytes.

Ziang using UV-vis spectroscopy.

In each coating step, the nanorods are characterized with UV-vis, dynamic light scattering (DLS), and zeta potential. UV-vis tells us the amount of light the nanorods absorb and the wavelength of the light that they absorb. As the length of the rods increases, the wavelength they absorb increases. DLS simply tells us the diameter, and zeta potential tells us about the surface charge of the rods. Each is important for us to ensure that each step of the nanorod coating process is done successfully!

From left to right: Graphs of the DLS, UV-vis, and Zeta Potential characterization data.

Now to the pH Experiments!

Once we have our coated gold nanorods, we do pH experiments on them. If you are unfamiliar with what pH is, it is a scale that typically goes from 0-14, 0 being the most acidic, and 14 being the most basic. Our coated nanorods are initially in a solution somewhere between a pH of 5 and 6. Our pH experiments involve pipetting sodium hydroxide (NaOH) into the solution to increase the pH of the solution. Sodium hydroxide is a strong base that when added into solutions makes them more basic (so base for basic), which is why we are using it for the pH experiments.

Hana at work as she sets up a pH experiment.

For the pH experiments, we are collecting characterization data (UV-vis and DLS) at 5 different pHs: 9.5, 10, 10.5, 11, and 11.5. The pH at 10.5 is important because this is when the pH matches the pKa of the solution, so chemical things happen that allow the nanorods to assemble. 

Imaging the Nanorods

Now you may be wondering if there is a way to see what the nanorods look like and the answer is yes! Using a fancy microscope called transmission electron microscopy (TEM), we can actually take images of the nanorods. It is quite tedious to prepare a sample for TEM analysis, but all of the preparation is worth the cool images. The TEM images are important because they are a visual indicator of self-assembly. Currently, we have been taking sets of TEM images of the control samples (so at the initial pH) and pH samples (these have a pH of 10.5). This past week, the lab drove up to Penn State to use another cool microscope called scanning electron microscope (SEM). The SEM we used is worth a couple million dollars, so it was a pretty big deal to use.

The photo on the left shows a TEM image of the nanorods. The photo on the right shows Ziang looking at a cluster of gold nanorods using the TEM.

The SEM we used up at Penn State. It was definitely worth the two and a half drive to use.

What Else Have We Been Up to?

During our spare time in the lab, we have been extremely busy doing other things like a cool Lego puzzle that members of Professor Buettner’s lab helped us finish (actually, they finished 90% of the puzzle for us…). On a real note though, there is also a lot of data analysis that we do which involves making lots of graphs and tables. And I mean A LOT. Anyway, here’s a picture of the completed Lego puzzle to end the post! We hope you learned a thing or two about the Nanolab!

Changing the Supporting Cation of Polystyrene Sulfonate (PSS)

So for my project (this is Isaiah), I follow the same procedural steps as Hana and Ziang until the first polymer coating where I use a different polymer called PSS instead of PAA. This polymer is a negatively charged polyelectrolyte that has the following structure:

What we are interested in with this polymer is how the supporting cation, in this case sodium, affects the electrostatic interactions between the gold nanoparticle and the polymer. This is so that we can gain a better understanding of the amount of polymer that stays on the nanoparticle since the layer-by-layer technique depends on electrostatics. The main takeaway is understanding the difference between layers of polymer that are tightly attached and more loosely attached to the nanoparticle. And in order to properly analyze this, consistent polymer packing is needed across the polymer which is why spherical gold nanoparticles are being used for my research as opposed to nanorods due to their constant surface. In order to characterize my particles, I use UV-vis spectroscopy, DLS, and zeta potential.

So how are we going to do this? By using a centrifugal dialysis process as detailed below:

Using this process we are able to separate and collect polymer that is not fully adsorbed on the nanoparticle. Depending on what stage of the process the polymer gets separated in, it gives insight to how tightly adsorbed the polymer was. With these filtration samples, I am able to get concentration information of specific elements using ICP-OES/AES (Inductively Coupled Plasma Optical/Atomic Emission Spectroscopy). This technique of spectroscopy utilizes an argon plasma to superheat a sample. In our case these are the dialysis samples. When the electrons of the sample are excited and return to their ground state, a photon is emitted. The ICP contains an array of sensors that collect light at different wavelengths. Depending on what element and elemental wavelength you specify the ICP to collect, concentration data can be collected.

However in order to use the ICP effectively, accurate and precise calibration curves have to be made to compare our sample to which is what I have been doing as of late. For our calibration curves to be up to standard, they need an R^2 value of about 0.9999. This has posed quite the challenge, but the calibrations I have done are getting closer to the desired value. So far I have done calibrations of gold and sulfur. Here are two of them:

Gold calibration curve from 100-1000 ppb analyzing at the elemental wavelength Au 267.595

Sulfur calibration curve from 100-1000 ppb analyzing at the elemental wavelength S 180.669

The data received from the ICP will allow me to calculate exactly what amount of polymer desorbs from the nanoparticle at which stage of dialysis. This can give a degree of understanding to the electrostatic strength of sodium as the supporting cation of PSS.

So What’s Next?

The next steps of this project are to finish making the calibration curves for the ICP and then analyze the dialysis samples that I have made. This will give us data to firstly reinforce data gained by previous students, and secondly new data on the amount of sodium ions that are in solution at each stage of the dialysis process. Furthermore, traditional dialysis techniques will be used in order to substitute the sodium ions of PSS with the following ions: lithium, potassium, magnesium, and calcium. With these newly formed modifications of PSS, the centrifugal dialysis process and ICP analysis will be performed in order to compare the differences in polymer adsorption between each supporting cation. I hope you enjoyed learning about my research, thank you for reading!

Home on The Host Range

We, the Delesalle Lab, work with bacteriophages (phages for short!). Phages are viruses that “eat” bacteria and are the most numerous organisms in the world. There are an estimated 1031 phages on Earth, more than any other domain combined. They “eat” bacteria by injecting their DNA and hijacking the bacterial DNA replication processes to reproduce more phage particles. The new phages can either be immediately made and explode out of the bacteria (lytic phages) or rest dormant in a bacterial cell with phage DNA integrated into the genome (prophages). Since phages cannot reproduce by themselves, they can be considered to be non-living. Phages and bacteria are in a continual “arms race” as the phages evolve to better eat the bacteria while the bacteria evolve to better defend themselves. Back and better than ever after a year off and a whole new team, the lab has been working on gathering host range data for a collection of novel phages and continuing to work with our passaging samples from the last two years.

Get to Know the Phamily

A Day in the Life of a Phage Tamer

  • Arrive at 9am and check the extensive list of chores Megan wrote down
  • We check our data results from any plates made the previous day
  • Luke runs his galaxy, Mark and Tabitha check on their 96 well plates, and Megan checks on her phage plates
  • Clean up the household –> autoclaving, making plates, dishwashing, bin washing, and restocking (sometimes do a little bit of shopping in the dungeon)
  • Get started on our projects for the day
  • Lunch! (sometimes we have lab meetings while we eat)
  • Finish up our projects
  • Debrief at the end of day
  • Create another To Do list for the next day

This summer we are tackling a handful of projects. As of now we are titering (determining the concentration) and amplifying (increasing the concentration) 16 novel phages to plate them against 14 bacteria strains. We determine the concentration of the phage by counting the number of plaques (tiny clear holes in the agar) at a certain dilution of our phage sample.

This process of titering and amplification if for an experiment called a host range experiment. This is done to determine the phages ability to infect different strains of bacteria. gathering images and host range data on 16 bacteriophages that have already been sequenced. In order to do this the phage are spot tested. Spot Testing is a common and relatively simple technique for phage research that involves applying a small amount of phage solution to a thin layer of bacteria spread on a Petri dish known as a bacteria lawn and allowing phages to diffuse and infect the bacteria. If the phages are able to infect the bacteria host cells, a clear spot will form in that lawn indicating where the phages have lysed the bacteria. We are also using a machine called Plate Reader, which measures bacterial growth by calculating how much light it absorbs. Different strains of bacteria will absorb different amounts of light, and if that strain is infected by a phage, it will absorb less light. We are gathering all the absorbance data by plating different bacterial strains and phages in 96-well plates and then putting them in the plate reader for 24 hours. Once we have all that, we will compare absorbance curves for bacteria growth in the absence or presence of different phages. 

A second project in our lab is comparing the impact of ancestral phages, evolved phages, and coevolved phages on coevolved bacteria and ancestral bacteria. This is a continuation of the passaging sample data work that is has been done the last few years. This data will possibly help us determine if mutations that arise in the genomes of phage and bacteria due to coevolutionary arms race, have an impact on the infectivity and defense of the phage and bacteria respectively. It considers the possible relationship between genetic changes in two strains of phages (evolved and coevolved) and their ability to infect two strains of coevolved bacterial hosts. The approach is to constitute growth curves for the ancestral bacteria when growing alone, exposed to the ancestral phage, and exposed to evolved/coevolved phages. The bacteria population growth is measured spectrophotometrically – the lower the absorbance, the less dense the bacteria culture, and the more effective the phage can lyse its host!

The third project of our lab also works with the data from our passaging experiments. This project focuses on analyzing the mutations that were found in the extracted genomes of the passaging samples. Using a workflow pipeline in a website called Galaxy, we can identity variations and amino acids changes from our passaging samples by comparing them against a reference phage genome. Additionally, we are able to observe the frequency of these variations in the population as well as when they appear and if they disappear. By looking at this data, we hope it will help us investigate the ability for wild and domesticated phages to adapt to their domesticated and wild bacterial hosts.

Variants identified in SPP1 phage and T89-06 bacteria evolved treatment on day 4.