What Doesn’t Kill You Makes You Fong-er

Welcome to Fong’s Lab!
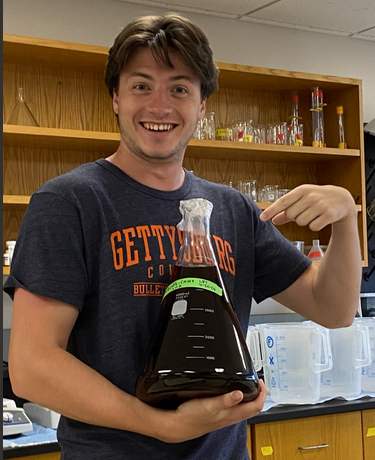
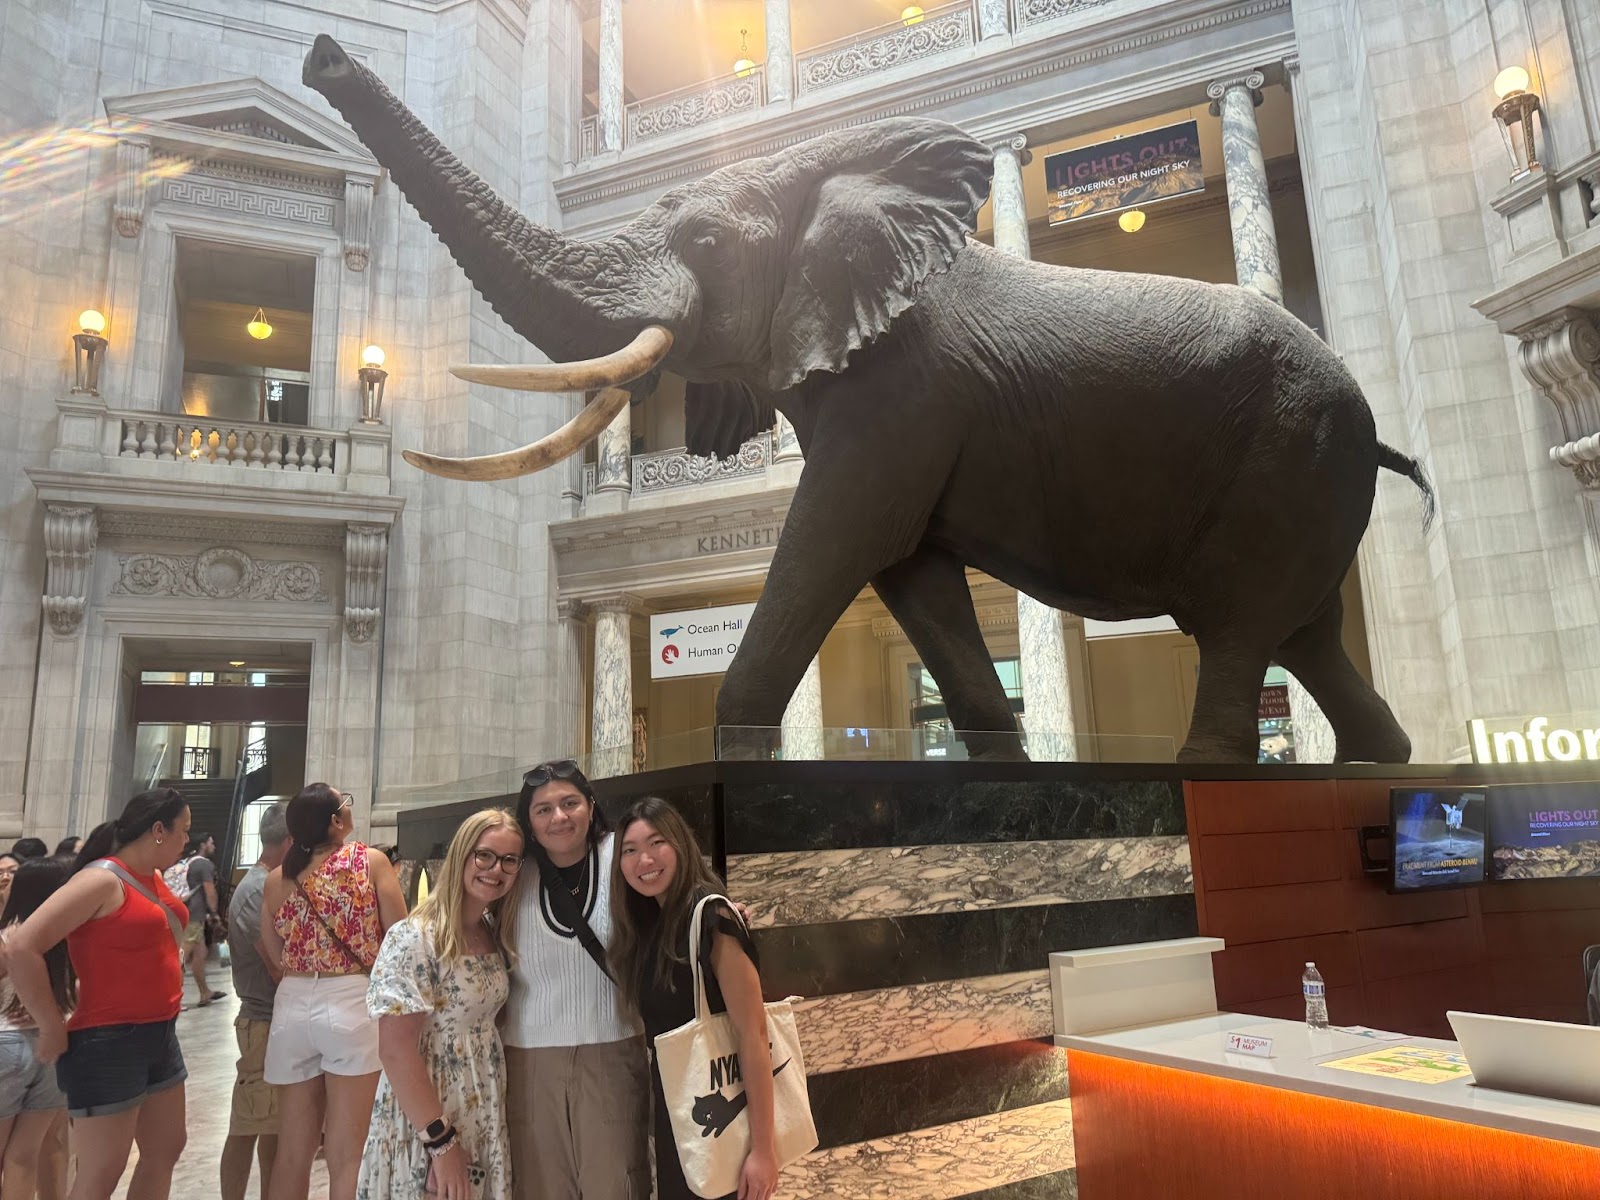
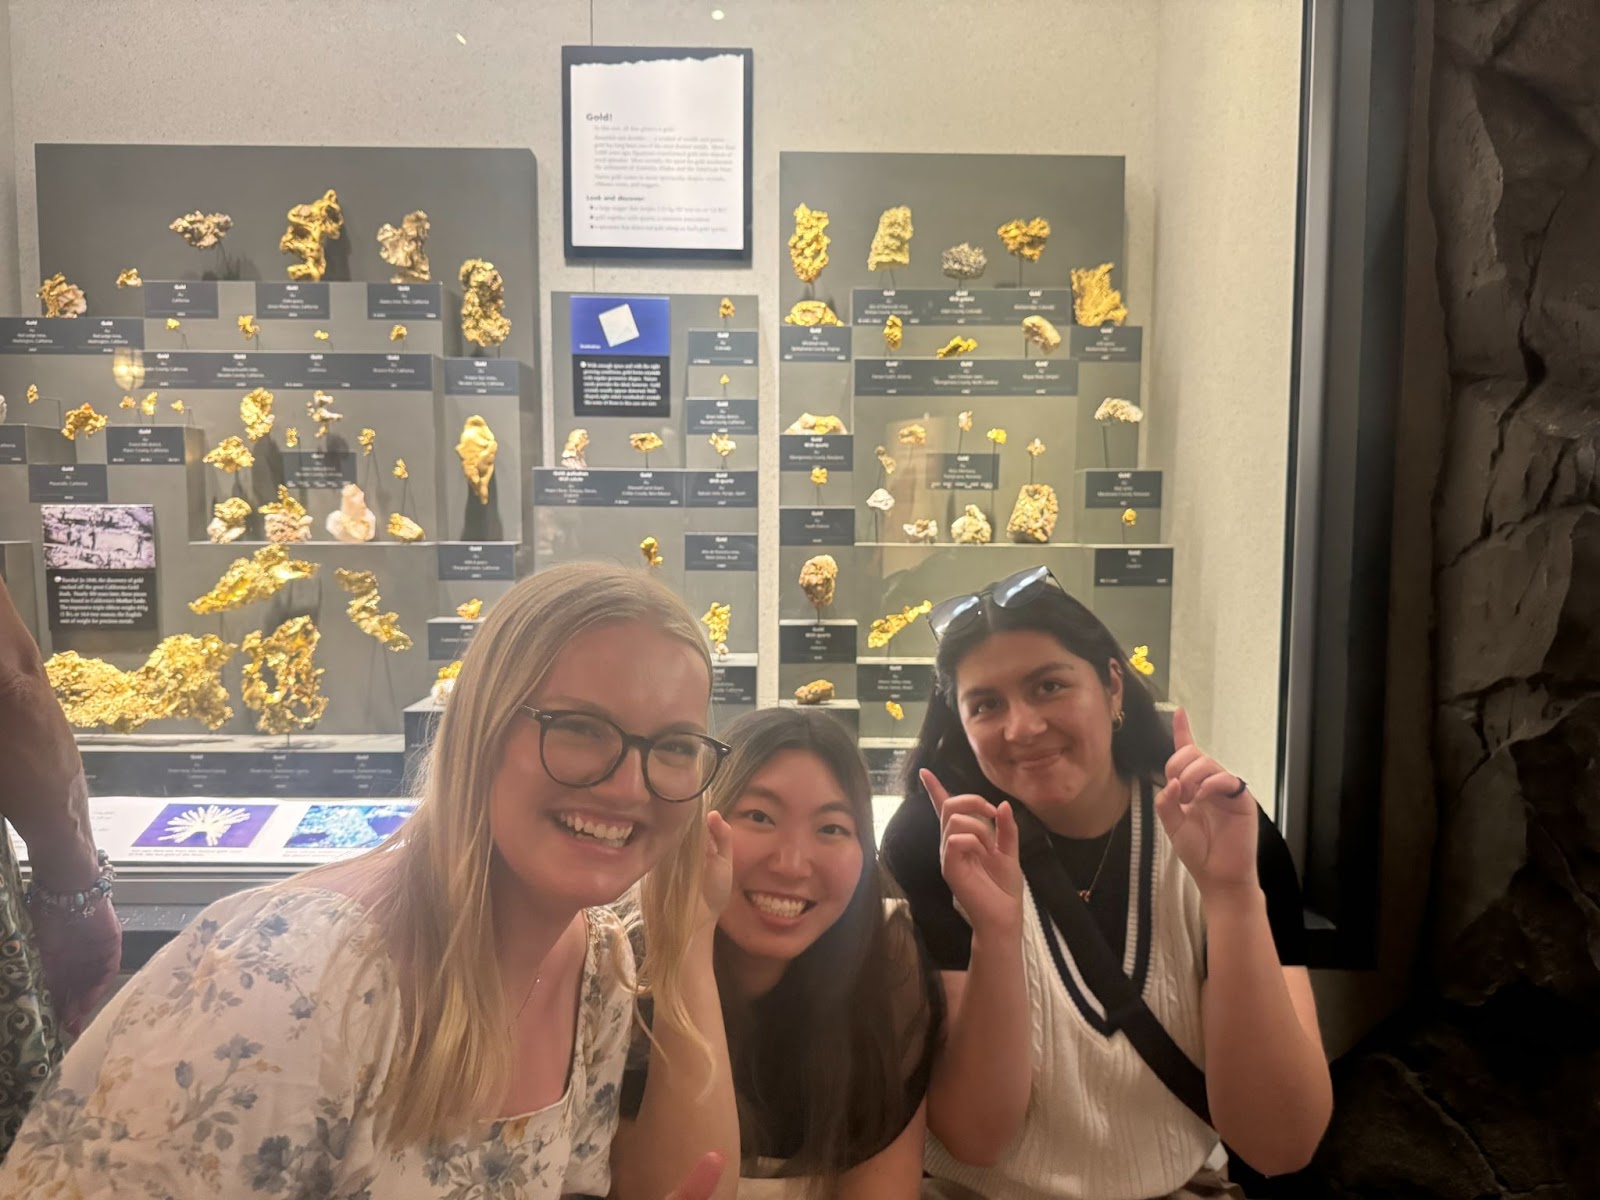
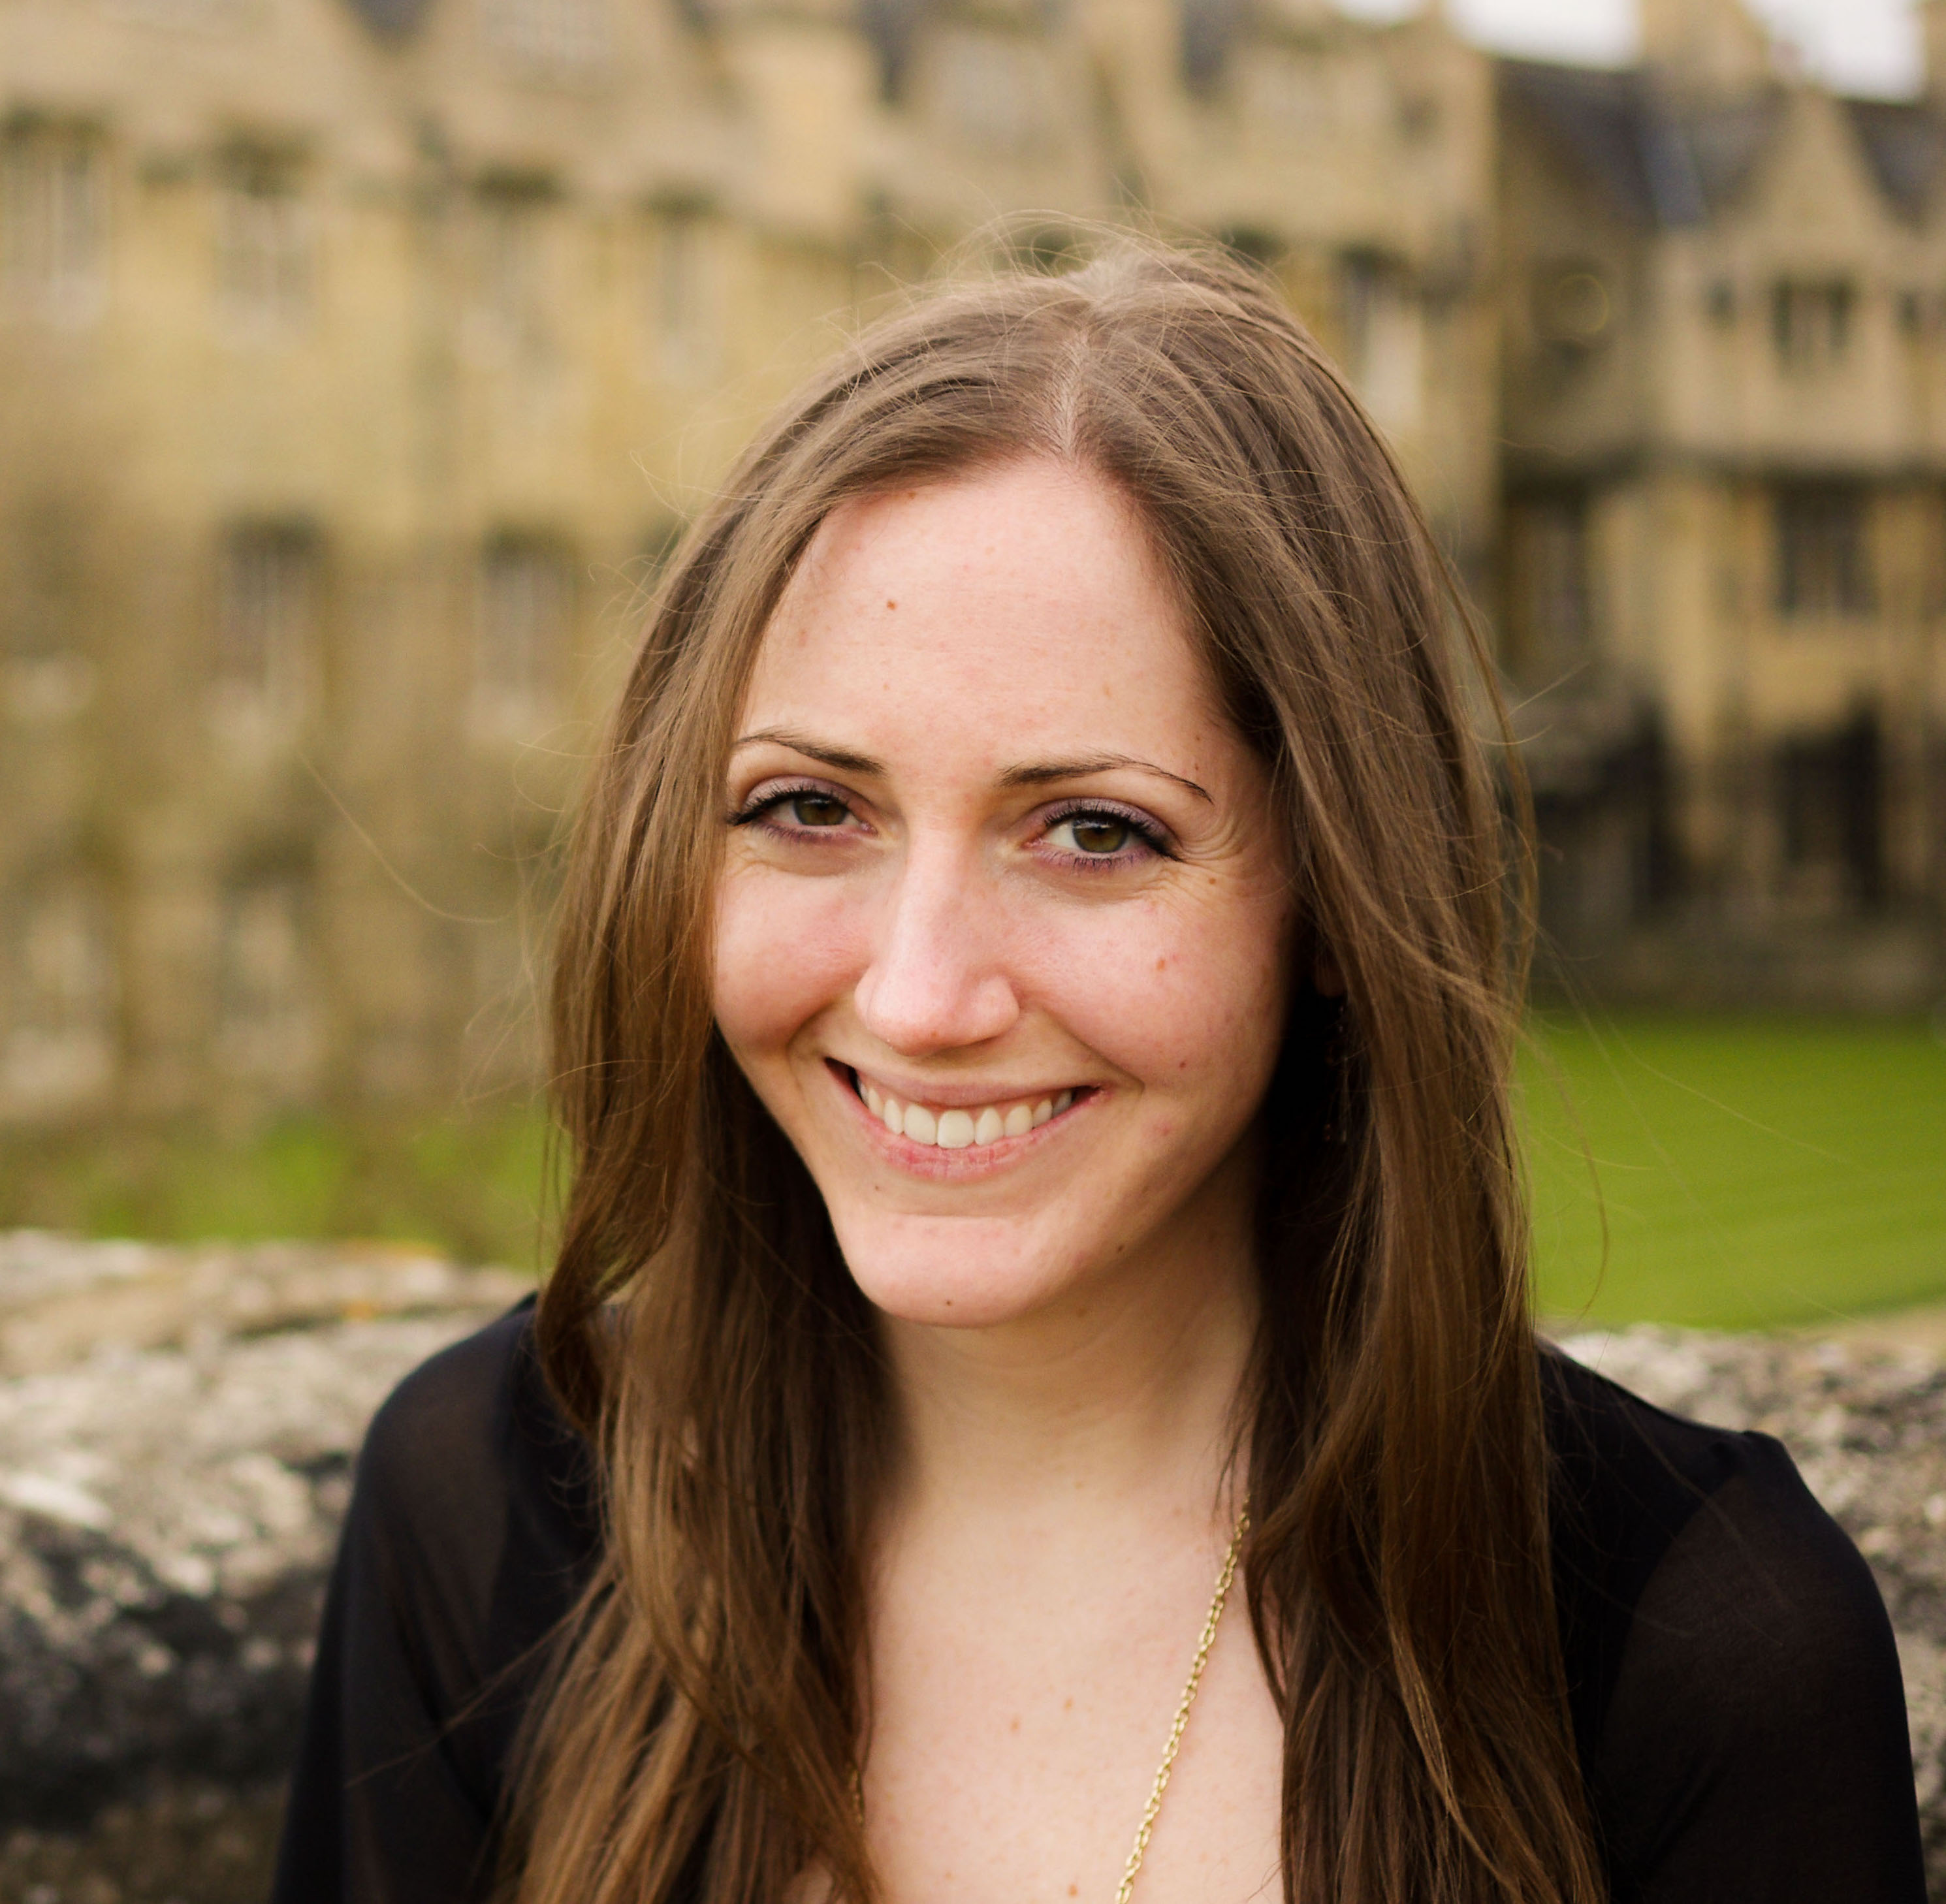
Meet the gang!

From left to right: William Leopold, Ryan Borgman & Morgan Nieman

My name is William Leopold – I’m a music and biology major, and I’m from the best state in this country (New Jersey). In the lab, you can find me carrying too much glassware at once, gently carrying frogs to that big pond in the sky, staring at tadpoles until they grow front legs, and begging Dr. Fong to stop gatekeeping his best fishing spots. Outside of lab, I spend most of my time practicing piano, or honing my breaking and entering skills when the rooms with good pianos in Schmucker hall are locked. Once I’ve practiced enough that I feel I have to get a life, I’ve had fun this summer with volleyball games, trips to Dorney park, and trying to catch fish in the sweltering heat.  

Hi, my name is Ryan Borgman, I’m from Scituate, Massachusetts and I am a rising junior majoring in BMB. So far, I’ve really enjoyed my time here during the X-Sig program. When not in the lab I like to spend my time going to the gym, playing basketball and watching the Boston Celtics win their 18th NBA championship. I’ve also explored the surrounding areas with day trips to DC and Hershey Park and an upcoming trip to see world renowned Hootie and Blowfish Perform in Hershey Stadium. I chose this lab because it’s very hands on, I love working with the frogs and going out into the stream to collect various organisms like snails and clams. In the lab you can find me, graciously allowing frogs to visit with their ancestors and asking Dr. Fong “How bout those Celtics?”  

Hi everyone! My name is Morgan Nieman, and I’m a rising sophomore and a biochemistry and molecular biology major. I’m from New Jersey and this is my first summer participating in X-Sig, but I have been working in the lab since last semester. In the lab you’ll find me cleaning 24/7, triple checking that we have done everything for the day, and guiding frogs to their hoppy place (personally I like to think they’re going on vacation). Outside of the lab, you’ll find me working out, going on battlefield walks, cooking, and working in town. 

And most importantly — you’ll get to meet our frogs!

Research Background:

Aquatic pollution and global warming are rapidly growing environmental issues in the U.S.. Runoff from sewage treatment plants has become rampant as more antidepressants and environmental chemicals are entering natural waterways through human urination and defecation. This increase of antidepressants in the ecosystem has been observed to slow the development of aquatic organisms. Global warming also poses a threat to aquatic organisms as their environmental temperature rises drastically, they are significantly impacted developmentally. This is an incredibly pressing concern, as global warming is continuing to raise the environmental temperature. Previous research on tadpoles predicts that environmental chemicals such as antidepressants and gold nanoparticles affect the body size at metamorphosis and may cause delays in development. Furthermore, in tadpoles, increased environmental temperature has been shown to increase the rate of metamorphosis.

In all, frogs are in global decline due to pollution, climate change, pathogens, etc. Our research focuses on how climate change and pollution by gold nanoparticles (AuNPs) affect life cycle of wood frogs, specifically on their life span and body mass. In addition, how climate change affects the uptake of gold nanoparticles by tadpoles and frogs.

Experimental Set-Up:

There are seven experimental groups per temperature treatment. Our temperature treatments are 15°C, 20°C, and 25°C.

The experiment groups include:

  1. Citrate (control) for half larval life [28 days].
  2. AuNPs for half larval life [28 days].
  3. Citrate (control) for full larval life [at metamorphosis].
  4. AuNPs for full larval life [at metamorphosis].
  5. Life cycle exposure to citrate.
  6. Life cycle exposure to water.
  7. Life cycle exposure to AuNPs.

So, there are a total of 21 groups for this experiment. (Which leaves us with a lot of containers!)

Ribbit-ing Experimental Design:

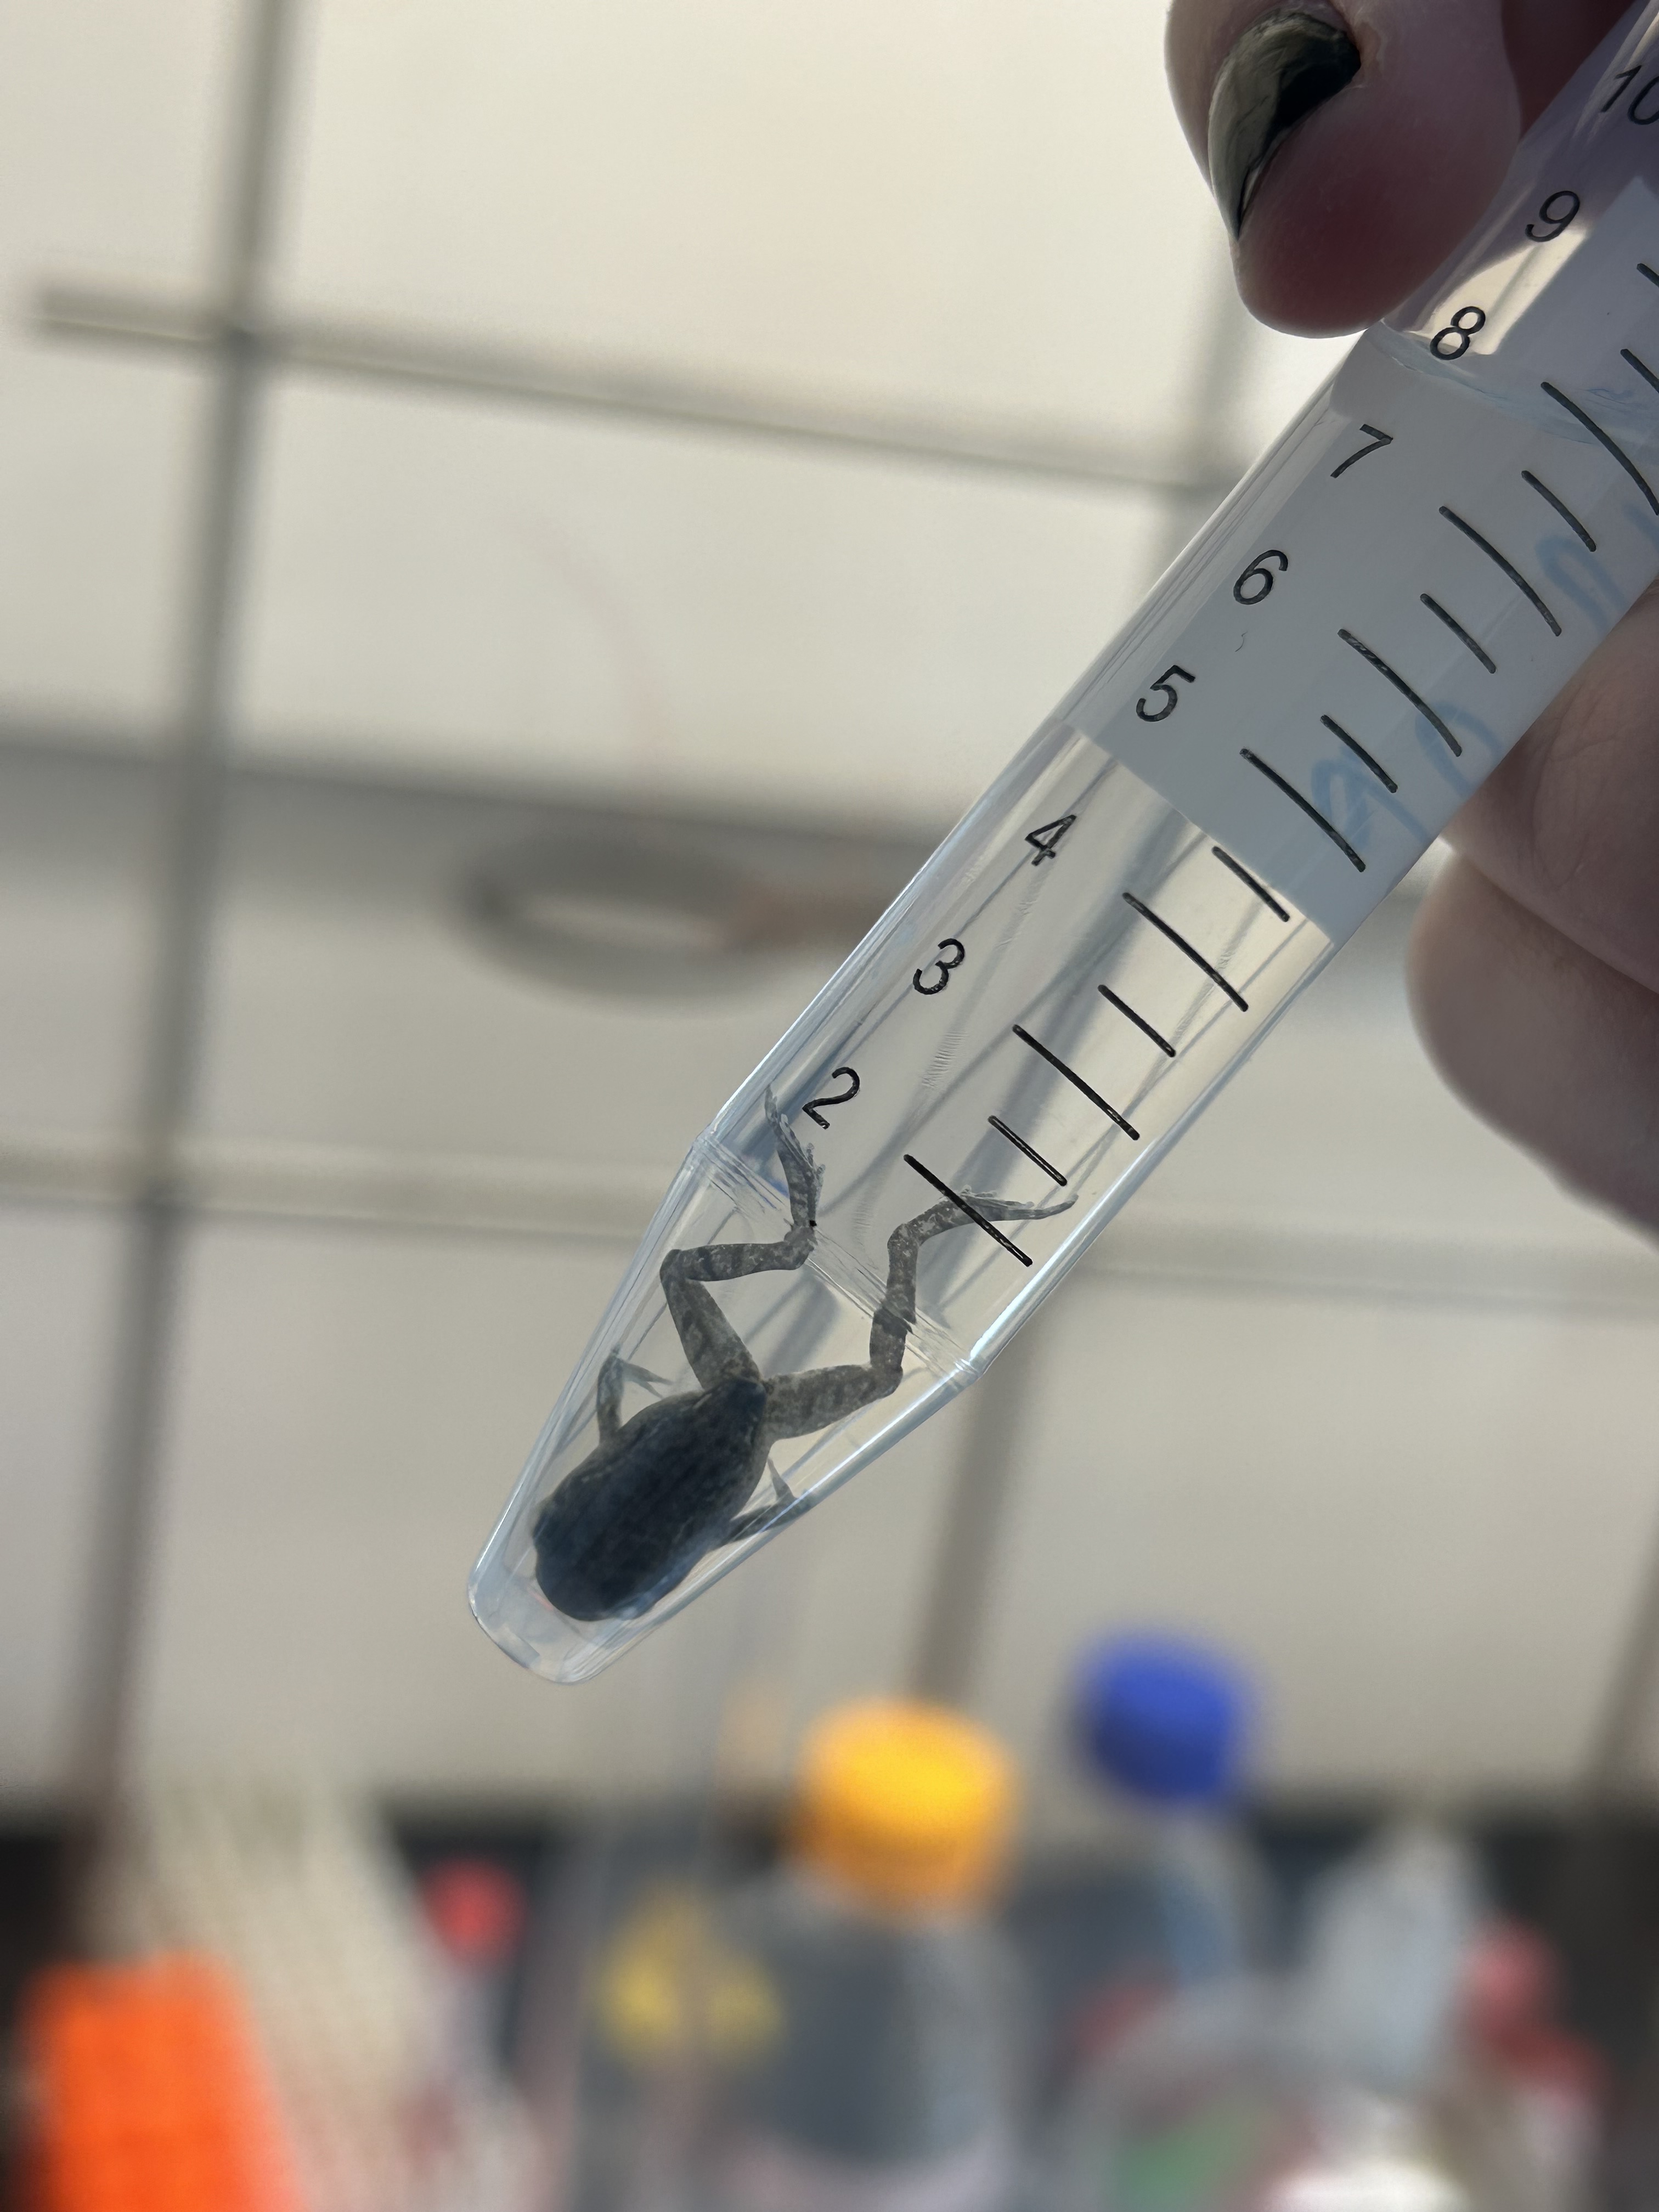
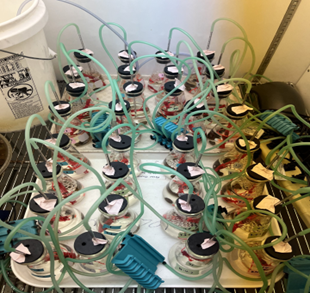
In order to expose our growing tadpoles to controlled temperatures and gold nanoparticles (or a lack of), we devised a complex and sophisticated experimental design that allows for both control and convenience. Essentially, we have several plastic containers filled with water, or citrate, or gold nanoparticles dissolved in citrate. The tadpoles call these small tupperwares their home, and we change their water / citrate / gold solution for a fresh batch once a week. As I said, high tech. Our tadpoles sit eagerly in these plastic containers until it’s finally time for their special day. When we do our daily round and see that one of them has sprouted front legs, we promote the soon-to-be froglet to a higher class of living – the same container, but with much less solution and now sporting two seashells for the froglet to stand on.  

Look how much he loves his seashell! We give them many comforts in their final moments. Once the last traces of the tail are finally gone and the froglet has completed its metamorphosis, it is ready for its one true purpose – euthanasia.  While we are all sad to see them go, we record their mass and then tearfully wave them across the rainbow bridge. Once the frog is fully submerged in the tube of ethanol, it is ready to be sent to Dr. Thompson’s lab, where talented chemists will analyze just how much gold nanoparticles that frog has taken up over the course of its short life. Since the gold particles are contained in a citrate solution, a citrate control group without nanoparticles is also analyzed. Our three temperature groups allow us to assess how temperature affects the uptake of gold nanoparticles, as well as how temperature affects growth and development of the frog, which we measure through time to metamorphose as well as their mass taken just before the coup de grâce. Towards the beginning of the summer, a number of tadpoles at roughly the halfway point in development were also weighed and prepared for analysis, as a means of making the same assessments as the frogs, but at a much earlier developmental stage. By using the numbered system of Gosner stages, we were able to numerically categorize just how far along each tadpole was in development at the time of death, providing us with additional insight into how both temperature and gold exposure can affect the speed at which they development, as well as how their size is affected at any stage. 

Our Results (so far…):

In our experiment we’ve discovered that the temperature has a significant impact on the size and time to metamorphose of these wood frogs. The frogs in the colder water (15 degrees) metamorphose much slower than the other warmer temperatures, the warmer temperatures grew four limbs before the 15 degrees. We found that although the metamorphose slower the size of the 15-degree frogs were much larger than the warmer temperatures. The warmest temperature (25 degrees) have metamorphosed faster than the other two temperatures but they are the smallest in size. The 20 degrees are somewhere in the middle. They metamorphosed faster than the 15 but slower than the 25 and were smaller than the 15’s and larger than the 25’s on average. These results tell us that the warmer temperatures result in faster metamorphosis in the frogs and this faster metamorphosis means that the frogs are much smaller due to less growing time before they begin to metamorphose.  

This can present problems in our world today with rising temperature due to global warming. The rising temperature means the frogs out in nature will start to metamorphose faster, meaning they will be full-grown frogs and leave the safety of their vernal pools much earlier and much smaller than they should be. Due to their smaller size, they will be subject to predation from a multitude of organisms. This can create a significant decrease in the frog population and throw the entire ecosystem into a frenzy.  

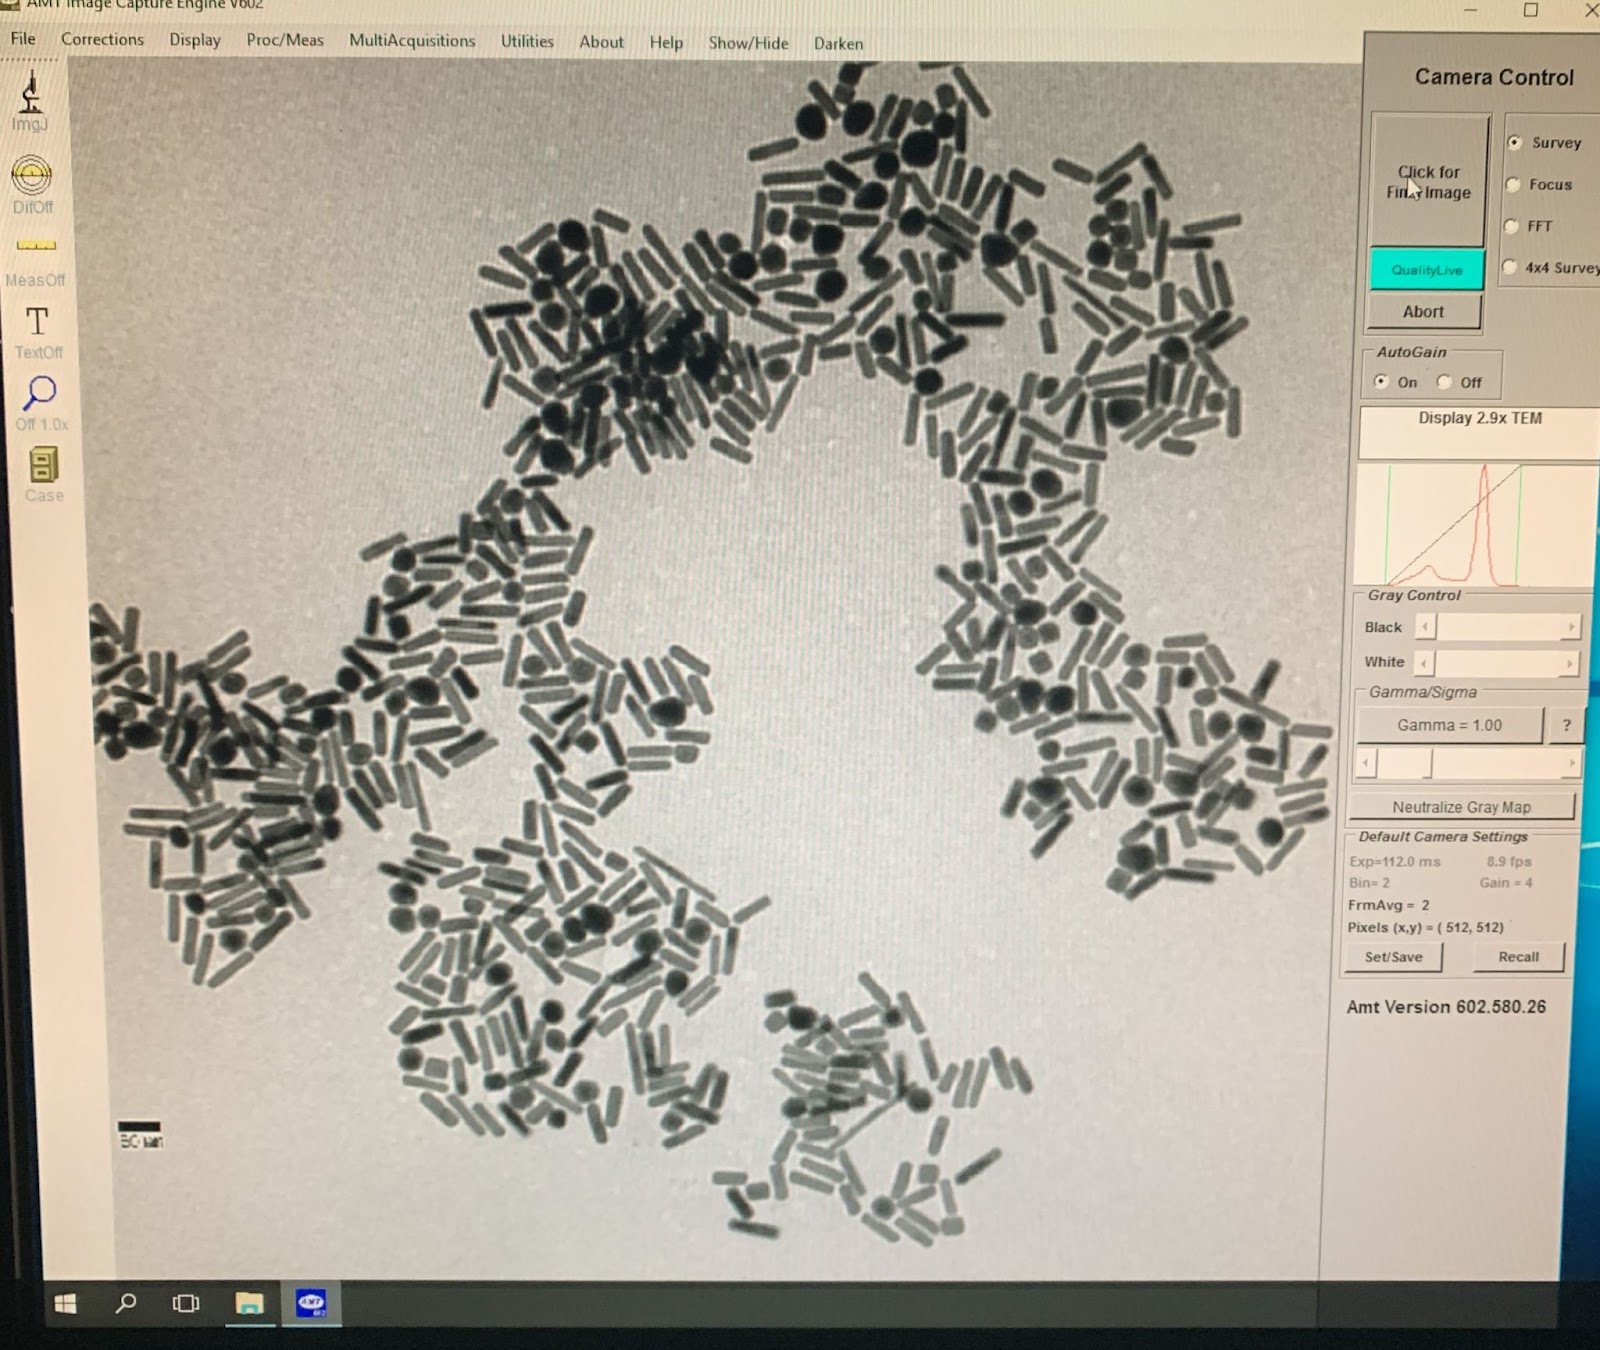
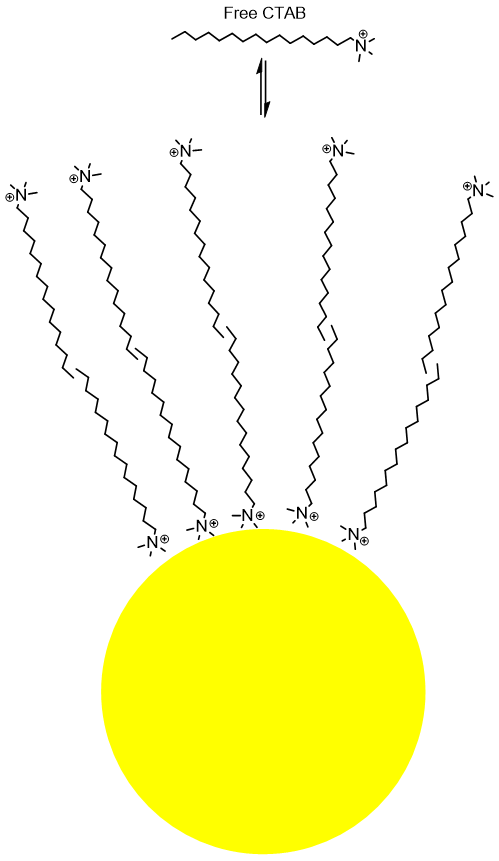
We also looked at how pollution in our lakes and ponds may affect the metamorphosis of the wood frogs. We treated a group of tadpoles with a gold solution to look at how the gold in the water affects the absorption rate in the frogs. Gold represents pollutants that may be present in our bodies of water. After the frogs metamorphose, we process and send them to Professor Thompson’s lab, who then can tell us how much of the gold nanoparticles were absorbed by each frog. We also wanted to look at how gold impacts the rate of metamorphosis in frogs. So far, the data is looking like the frogs in the gold solution are metamorphosing faster, however this is after just briefly looking at the data, not all data points are in yet and no significant tests have been run yet. 

That’s it for now. We hope you enjoyed catching up with Fong’s lab!

Petit Manan Island – Remote Living, Puffins, and Chicks Everywhere!

Hello, all! I am Leah Nath and have been working in the Gownaris lab this summer on Petit Manan Island, Maine. Our crew is made up of Tasha Gownaris (ES Professor), Jocie Little (’25), Logan Becker (’25), and a technician (Devin Leal) and supervisor hired by USFWS (Amanda McFarland). The island, where we are staying for all of June and July, is a forty-minute boat ride from the mainland. USFWS staff from the mainland bring us our food and drinking water weekly. The island is very small and doesn’t have any trees, but it does have one house that we are staying in, a boathouse, two sheds, and the second-tallest lighthouse in Maine!

My first view of the island from the mainland

Our beautiful view from the island at sunset

Our primary tasks involve monitoring and management of the different bird species on the island, which mainly entails tracking predation attempts by laughing gulls and peregrine falcons and collecting productivity and diet data. We track the number of nests and adults of the seabirds, the dates that chicks hatch, the linear growth rate of chicks, the success of fledging, and feeding rates and prey items throughout the season. In our full census of the island, we found a total of 1,072 tern nests, meaning there are at least 2,144 terns on the island, 35% of which are Arctic terns Sterna paradisaea (a state threatened species) and 65% common terns Sterna hirundo. The terns this year are doing an excellent job of parenting by incubating their eggs and keeping them safe by hitting us over the head and pooping on us constantly; we are proud of their commitment even despite being their targets. We also have one of four Atlantic puffin Fratercula arctica (a state threatened species) colonies in North America. Unfortunately the puffins have needed to work hard to rebuild its burrows, which were nearly all destroyed over the past winter due to extreme storms – another effect of climate change. Besides terns and puffins, we also collect data on black guillemots Cepphus grylle, razorbills Alca torda (state threatened), common eiders Somateria mollissima, common murres Uria aalge, and Leach’s storm petrels Hydrobates leucorhous.

Summary of some of the species living on the island; photos taken by various crew members over the past two years.

Handling and banding my first bird (a common tern)!

A common tern posing on Jocie Little’s head

First Arctic tern chick, which hatched on 06/13. Arctic terns fledge their nest at around 21 days old.

Handling and measuring my first tern chick!

Trophic Ecology Data

In addition to the regular monitoring on the island, we are here to collect data on the trophic ecology of terns and alcids to better understand how these species are responding to rapid climate change in the region. We collect trophic ecology data using three approaches: GPS tagging, provisioning watches, and stable isotope analysis.

GPS TAGGING
We have now finished tern GPS tagging, which involves trapping Arctic and common terns with treadle and box net traps to attach a GPS tag and harness, attach lifetime serial bands, and collect measurement data. The GPS data will help to inform where the terns are traveling, so as to protect them from the impact of proposed offshore wind farms in upcoming years and to track the impact of global warming on these birds. Terns are typically expected to forage within 20-30 km of their nests, but last year’s tagging data found that they were traveling as far as 120 km to forage for the most nutritious fish available (hake and herring). We will also attach tags to puffins, guillemots, and storm petrels to look at these questions across species; Linda Welch, the Supervisory Wildlife Biologist at the Fish and Wildlife Service, will be coming to the island to help with tagging for these species, as the alcid tags are attached with suturing rather than a harness.

Professor Tasha Gownaris attaching a GPS tag to a tern on Metinic Rock using a leg-loop harness.

Tasha and Logan Becker (’25) attaching a tern tag using a leg-loop harness on PMI

PROVISIONING WATCHES

The Gulf of Maine is warming faster than nearly any other place on Earth, so understanding the individual and colony-wide changes these birds are making can provide a better understanding of adaptability to potentially similar changes that may be seen in other places around the world soon. Hake and herring, the tern’s ideal prey, are swimming farther offshore to find colder ocean temperatures. While some of the birds are foraging farther distances to find these fish, others are choosing to feed more often with invertebrates and other prey closer to the island. To understand what the birds are eating, where they are getting it from, and how it is impacting their growth, we will pair the GPS data to provisioning stints (three hour sections of watching certain nests each day) to compare foraging locations with feeding choices. As a group, our team has begun working on a paper to analyze provisioning data over time to see how the terns have changed their behaviors in the last twenty years. We will also be establishing additional provisioning stints for puffin burrows next week. For puffins, we take photos of the birds flying in with fish and identify the fish back in the lab.

My first provisioning stint of the season!

ISOTOPE ANALYSIS

Along with our tagging and provisioning data, we have been collecting different types of samples to send for stable isotope analysis. These samples have included/will include egg membranes (pre-breeding diet) and blood samples (blood cells for diet from the last 2-3 weeks, plasma for diet from the last 2-3 days). By looking at the samples in conjunction with the tagging and provisioning data, we will be able to gather a robust sense of what the chicks are being fed and from where, as well as how this diet is impacting their growth development.

With a month left to go, I cannot wait to keep learning and interacting with these birds. Soon, I will begin learning to handle puffins and guillemots, as well as take blood samples from tern chicks. I also am particularly excited to monitor the development of one burrow which has a puffin egg and razorbill egg together! I hope to be able to learn as much as I possibly can and be able to add to the work that this team and Dr. Tasha Gownaris have been building up so impressively for the past few years!

Neutron Spin Rotation, and it’s potential explanation for the 5th force

Hi. My name is Harry Nelson. I am a rising senior majoring in Physics with a minor in Business. This summer, I am doing research in collaboration with Professor Crawford and the Neutron Spin Rotation (NSR) group to determine if there is a new “5th force”.

In our universe, scientists have only been able to detect four forces; gravity, electromagnetism, strong nuclear force, and weak nuclear force. Since 1935, these four forces have been able to explain almost everything we know about the universe. However, when scientists measured the rotational speed of galaxies, and using our understanding of physics and the gravitational forces at play, they predicted the mass of the galaxy, which is bigger than the visible mass. This has led many to speculate that there is some mass that we are not able to measure yet. Theorists are proposing lots of theories, one of which includes very weak forces and their associated very light particles.

Unlike protons and electrons, isolating neutrons requires either a nuclear reactor or a spallation neutron source. While a nuclear reactor generates neutrons from fission (splitting nuclei), a spallation neutron source uses a high energy proton beam to strike an object (usually a very dense metal i.e. tungsten), producing 10-20 neutrons per proton. In order to run experiments and tests on neutrons in the United States, you would have to go to a national laboratory in order to do these tests. Originally, the NSR collaboration planned to run these experiments at the National Institute of Science and Technology (NIST) using their NG-C beamline on the NCNR reactor. However, due to complications with the reactor, they are considering running the experiments at Oak Ridge National Laboratory using their BL-13 beamline at the Spallation Neutron Source (SNS).

The NSR apparatus first polarizes the neutrons, allowing only those whose spin is oriented upwards continue down the beamline. Next, they go through wave guides before reaching the target zone, which hopes to induce the 5th force to act upon the neutron. After that, the neutrons go through another polarizer, and then enter a detector. By changing conditions of the apparatus, we can determine how much the neutron spin rotates in the target. 

Figure 1: Top-down diagram of the NSR apparatus

I am running simulations of our apparatus using McStas, a neutron simulation program. To use it, you place different machine components and monitors together using their library. Next, the program compiles itself into C, and from there you can run it. By changing the neutron source from the NG-C beam to the SNS beam, I can compare the two and see how the experiment will be affected by the change.

Figure 2: What the apparatus looks like when simulated

Using the energy, we can determine the speed of the neutron, as well as the wavelength. Not all of the neutrons will make it to the end, however. Each time a neutron hits a wall, there is a chance that the neutron will pass through the wall of the waveguide and be lost. This chance depends on the speed and angle of the neutron, where a neutron with a high speed and/or a large angle (relative to the wall) has a smaller chance of making it down the beamline than a neutron with low speed and/or an angle more parallel to the wall. As shown on the graphs, while the BL13 beam does have neutrons that are slower, it has a larger exiting angle, such that only 2.8% of neutrons make it to the detector, while 3.0% of NGC neutrons make it to the detector.

Figure 3: Left: Intensities of each beam at the source and at the end of the simulation. Right: Intensities normalized

Figure 4: Angle distribution for NG-C beamline

Figure 5: Angle distribution for BL-13 beamline

By discovering and documenting how the NG-C and BL-13 beamlines act differently in our apparatus, I am helping the NSR collaboration decide whether or not they want to move the apparatus from NIST to Oak Ridge.

Life of a proton in Crawford Lab

Hello, we are Emmanuel and Deepanjali, and this summer, we’ve been tormenting several particles to study the proton energy loss through thin gold films to study neutron half-life.Neutrons tend to be shy about their age, however we nosy humans are on a hunt to discover their half life. The half-life of a neutron is the time taken by half of a given number of neutrons to decay. Neutrons decay into protons, electrons, and antineutrinos through a process known as beta decay. Understanding neutron half-life is quintessential in understanding physics- elemental abundance in the universe, fundamental particle interactions and ultimately understanding the origin of the universe.

(Image-1: Deepanjali left and Emmanuel right.)

One method of measuring the lifetime of a neutron involves detecting protons decaying from a neuron beam, a technique known as the in-beam method. However, protons witness a loss of energy while passing through a gold layer in gold-based semiconductor detectors, introducing uncertainty to lifetime measurements. In order to address this discrepancy, we are studying how protons loose energy as they enter the proton detectors. We create thin gold films on part of the face of the detector and accurately measure their thickness using UV-Vis Spectroscopy. Then we put protons on the detector, either through the gold film or directly into the detector.

Van de Graff Accelerator

Our journey begins inside the Van de Graaff accelerator, a machine engineered to create a large potential difference for accelerating protons. This is accomplished by transporting charge from the ground up to a higher voltage dome. Imagine a drive motor spinning a rubber belt that contacts a screen, which is connected to a high-voltage supply to manage charge. This year, we addressed two key issues: we replaced the belt and the screen. The old mesh-like screen was damaging the rubber belt (not good).

(Image 2- Van de Graft accelerator without the dome)

A net positive charge is generated on the belt by placing a positive charge on the screen, which attracts electrons away from the belt, leaving it positively charged. This charge is then carried up to the high-voltage dome. Once the charge reaches the dome, a potential difference is established between it and the ground, enabling the acceleration of protons. We can regulate the amount of charge on the dome using corona needles.

The accelerated protons originate from an ion source inside the accelerator, connected to a bottle containing hydrogen. It took considerable time to adjust the bottle to generate the required plasma. By fine-tuning an LC circuit, we managed to produce the appropriate radio frequency (RF) oscillator needed to excite the hydrogen gas, thereby ionizing it into multiple particles within a plasma bottle. A Van de Graaff generator, which generates a substantial electric potential, facilitated the acceleration of ions into a beam tube. Along the beam’s path, strategically positioned pairs of slits ensured the beam is traveling straight down the beam line.

The Beam Line 

After being accelerated, the protons are directed into a drift tube or beam line, which is kept under high vacuum conditions using two sets of specialized vacuum pumps. A controllable steering magnet is strategically placed midway along the path to ensure the protons are accurately guided toward the target chamber. This magnet generates a uniform magnetic field and utilizes the Lorentz force to steer the protons based on their mass and energy.

Once the proton beam successfully passes through a narrow slit, it proceeds through a series of focusing magnets. These focusing devices are quadrupole magnets, designed to create a specific magnetic field configuration that effectively ‘squeezes’ and focuses the proton beam, enhancing its precision and intensity.

(Image 3: The beam line)

The Target Chamber and Detector

The target chamber is a cylindrical apparatus equipped with a centrally located target holder, as illustrated in Image 4. The target holder can be precisely rotated a full 360 degrees using an external knob. Additionally, the chamber features two rotatable arms, designated as the upper arm and the lower arm, each capable of supporting a detector via a detector holder. These arms can also be adjusted via exterior knobs, allowing for precise angular positioning. A scale on the chamber’s exterior provides readouts for the angles of both the arms and the target holder.

Once the protons have been guided and focused through the transmission beam line, they enter the target chamber where our silicon detector is positioned. This detector is connected to an amplifier, which serves to enhance the signals it receives. The amplified signals are then transmitted to a computer for visualization and further analysis.

(Image 4:The target chamber)

(Image 5: Beam line and target chamber)

Energy Calibration with known sources 

In order to calibrate our unknown proton energy, we needed energy calibrations for known sources. In our case we used sources like Americium(Am-241), Europium(Eu-152) and Barium(Ba-131). We placed each of these elements separately in front of our detector and analyzed their energy data using the MCA(multi- channel analyzer) software. We then compared these energy peaks with that of National Nuclear Data Center, since they have all the standard energy values. We will use these energy calibrations to calibrate our proton energies after detection. 

Data Collection Schematic plan

  • We will take Energy data for only the silicon detector
  • We have evaporated our Gold on our detector and calculated the thickness of the gold using the UV-vis method.
  • We will take energy data for Gold on a silicon detector
  • Take the difference in energy between the two energy data(Energy data for only silicon and that of gold and silicon).

SRIM (Stopping and Range of Ion Matter) calculation 

SRIM is a software program used for calculating the transfer of ions and matter. It has a core program called TRIM(Transport of Ion in Matter). The mechanism of the TRIM is very simple. You set an element at a particular velocity(You adjust the velocity) and it goes to your target layer which you set to any width and element you want. You can also choose the type of TRIM calculation you want. In our case there will be collisions so we chose the collision step and surface sputtering option. After running the TRIM, it will give you the energy loss data. In our case we set hydrogen ion (H) to the velocity we want, and we set the target to silicon(first) and gold on silicon(second). 

We will use the SRIM calculation as the intrinsic data and convolute it with a Gaussian instrumental response and compare it with our experimental data (the proton energy loss data we took in the lab)

Some of the adjustments we have made so far

We utilized the ICL and 3-d printed a cover for gold evaporation to ensure precise deposition of gold and a cap to cover the detector as the beam hits. Created two new targets to enhance proton focus on the detector. We also created a new full wave rectifier and replace the old one that is part the RF oscillator in the ion plasma source which produces the protons.

(Image 6: new full wave rectifier.)

Some of the challenges we have faced so far

Our work was not immune to unforeseen troubles-from accidentally damaging the ion source bottle to the plasma not striking, our lab experienced a fair deal of challenges. In order to accomplish the daunting task of changing the rubber belt, we had to dismantle the entire accelerator. Despite our precautions, we ended up breaking the ion-source bottle while putting things back together and had to replace the same. The replacement was a collaborative task that took a week , and multiple rounds to the chemistry department for cleaning and baking the bottle. 

(Image 7: Broken bottle)
Once the new bottle was settled in, our next task was closing and running the accelerator. While the bottle was striking with plasma when open, there seemed to be no generation of plasma once closed-this problem took approximately 2 weeks to resolve- explain fixes. Tightening transmission lines, refilling hydrogen bottle, And carefully shortening  thewire connecting adjustable capacitors-all these little tasks helped us overcome this problem.

(Image 8:Plasma striking)

Current Tasks

The accelerator is now running as expected, so we have begun taking energy data and look forward to analyzing more peaks in the upcoming weeks. 

Salty Stream Squad

Hey gang! We are Professor Eckert’s Lab and this summer we are continuing an ongoing research project studying interactions between living organisms in freshwater systems. The current variable we are testing is salinity changes in these systems due to an influx of road salt in the winter and spring seasons. Our lab studies how multiple members of the brown food web, decomposers such as fungi and bacteria, as well as macroinvertebrates respond to the changes in salinity and how this interacts with green food webs and algae to impact leaf decomposition, a key ecosystem process to recycle nutrients. 

Lab Members

Scott- Hey everyone, my name is Scott, and I am focused on the algal portion of the research that we are conducting this summer. I am a rising Junior and a double major in Environmental Studies and Biology. Throughout the year I am involved with the Center for Public Service at our Painted Turtle Farm, I work as a tour guide, and I am an executive in GECO the Gettysburg Environmental Concerns Organization.  

Aidan – Hello, my name is Aidan Sarmiere and I am an Environmental Studies major, a Biology minor, and a rising Junior. This summer, I am concentrating on the bacterial portion of the research for Dr. Eckert’s lab. When not counting bacteria or playing with leaf disks, I am typically watching baseball (specifically the Yankees) or hanging out with friends. This is the first time I have done any significant research of any kind, and it has been an incredibly awesome experience for me.  

Research Process

Salinity concentrations and their effect on stream ecology are still relatively new and as a result little is known about the effects, making the work we are doing even more important. Current evidence has suggested that increased concentrations in salinity affect the decomposition of plant life as the salt is absorbed through their roots and alters the makeup of their leaves. Additionally, road deicing salts are washed into stream systems with snowmelt and rain, increasing the overall salinity in streams and potentially altering leaf decomposition and stream organisms. These changes causes further issues in the brown food web as these leaves are what the majority of living organisms in small temperate stream systems use as energy. This understanding of salinity’s effect on leaf composition is the basis of our lab’s work where we study the rate of consumption of leaves by macroinvertebrates as well as the colonization of leaves by algae and bacteria at various levels of salinity. 

We began our research this summer by aggressively pounding leaves with a hammer (many apologies to our neighbors). The purpose behind this was to prepare a series of equally sized leaf disks of the dogwood variety, specifically Cornus florida. We prepared 410 leaves for each of our 4 salinity treatments.  

These leaves were divided into a series of 8 flasks per treatment for a total of 32 flasks per week for the 3 weeks that we ran our experiment this summer. Throughout the experiment, the masses of the leaf disks were monitored, and new disks were added each week. However, more often than not, our leaf samples had a neighbor. 

Within 5 of the 8 flasks per treatment, we additionally had placed a macroinvertebrate called an amphipod. Much earlier in our experiment, our lab took a road trip down to a body of water called Boiling Springs where we collected over 70 amphipods from the site. Amphipods are an important part of stream ecosystems as depending on the species they consume different parts of the leaf from the film covering it to the microorganisms colonizing it to the leaf itself. By including some of these organisms in the flasks we were able to measure how the changes in salinity affect these organisms’ growth but also how the rate of consumption could potentially change as well.  

To preserve these little guys, we established a complicated, yet necessary, series of tubing to ensure their survival, which was mostly successful. 

Currently following the conclusions of our data collection for the year we are working on sample processing. Scott is measuring the abundance and taxonomic composition of algal samples on our leaves. Through a painstaking process of visually counting over 400 algal cells per sample, he has seen a variety of unique specimens including diatoms, green algae, and cyanobacteria. Aidan is undertaking an equally exciting process of counting the bacterial samples. Unlike with the algae, we cannot identify the specific genus of the bacteria, so I instead am identifying the bacteria as shapes, or what we would call morphotypes. These shapes include spheres, ovals, rods of varying sizes, chains, and others. To do this, we need to use something called DAPI to stain the DNA of the bacteria, so it can be seen fluorescing under a special (and very expensive) microscope that can then photograph them to later be counted.  

Moving forward we hope that our work will be able to provide other ecologists with an understanding of how salinity impacts stream organisms and processes. Since road salts will continue to be in use until a more sustainable alternative is put into use, ideally our research will allow us to better understand and protect rivers and streams just like Boiling Springs. 

Super Fantastic NanoNerds

What’s up guys!! It’s your group, the NanoLab from the Chemistry Department, back with another X-SIG blog post! We got a couple of old and new faces to show you along with four projects going on in the lab this summer. Before you continue reading, be sure to SMASH that like button down below AND hit the subscribe button to stay updated with what’s going on in the lab (to actually stay updated with the lab, you can visit our lab website: nanolab – @ Gettysburg College). Also, comment down below what your favorite element is!! Now without further ado… let’s get into it. 

From left to right: Khristian Banks, Cole Springer, Dr. Thompson, Yesenia Posada Cruz, and Hana Konno.

Meet the Lab Members

Dr. Thompson: I’m supposedly in charge of the NanoLab but often I feel like I have no idea what I’m doing. I guess that’s part of doing research, right? I’m lucky to have four wonderful students working with me this summer and you’ll get to hear a little about their work below.

Cole Springer: Hi everyone, I’m Cole! I’m a rising senior and a chemistry and German studies major. This is my first summer in the NanoLab, but I’ve worked the past two summers with Dr. Funk on some organic synthesis, which I’ve gotten the chance to do this summer as well! My favorite element is Osmium because of its status as the densest element! I have a couple grams of it, and I find density to be a weirdly fascinating property of elements.

Hana Konno: Hi guys! My name is Hana, and I’m a rising junior and a chemistry major. This is my second summer in the NanoLab, and I am continuing on with the project that I have been working on since last summer. My favorite element is Einsteinium because the name sounds really cool. 

Yesenia Posada Cruz: What’s up everyone! My name is Yesenia, and I’m a rising senior chemistry major, math minor. This is my first summer in the NanoLab, but I have been working in the lab since last semester. My favorite elements are Yttrium and Xenon because they have very unique spellings! 

Khristian Banks: Hi everyone! My name is Khristian, and I am a rising sophomore majoring in chemistry and minoring in German Studies. This is my first summer in the NanoLab, and I’m working on an aquatic toxicology project in tadpoles at different temperatures. My favorite elements are chlorine and platinum! 

The NanoLab Projects

Project 1 (Hana): Polymer Functionalized Self-Assembly of Gold Nanorods using pH Modifications

Alright, so the basic rundown of my project is that I am synthesizing gold nanorods, then adding two different layers of chemicals called polymers onto the nanorods, and then raising the pH of the nanorod solution to get the nanorods to assemble. Gold nanorods look exactly what they sound like (very small rod-shaped pieces of gold). The image to the right is what a single nanorod looks like! What is special about the outer layer polymer (called Poly-l-lysine) that I coat onto my nanorods is that when the pH is near 10.5 (to match the pKa of the polymer), the polymer changes its structure, which is what drives the nanorod assembly. Gold nanorod assembly is important because it has a wide variety of applications including drug delivery, cancer therapy, etc. I am using a couple of different instruments to collect characterization data for my project, but the coolest instrument that I am going to mention is the Transmission Electron Microscope (aka the TEM). It is a very fancy microscope down in the Imaging Suite of the Science Center. Below is one of the images I took using the TEM! If everything goes well this summer, then my project will be published in a journal sometime in the near future!

Project 2 (Cole): Tuning the Adsorption of Polyelectrolytes to Gold Nanospheres

My project is heavily based on the question, “what happens if…?” From past work in the lab, we have been able to “coat” our gold nanospheres with polyelectrolytes (charged polymers) and quantify how much of the polymer adsorbs to each individual nanosphere (which are usually between 1-50 nm in diameter). This student’s work (Celina Harris) was actually published in a scientific journal! However, one question that arose from her work in the NanoLab was how to tune the amount of polyelectrolyte that adsorbs to our nanospheres. This is where my work starts.

Part of my project has been to synthesize a new intermediate layer (which we use to prevent the aggregation of nanospheres and control their size) that will allow us to quantify both how much of the intermediate layer and the polyelectrolyte coating is on the surface of the gold nanosphere. This would grant us insight into the electrostatic interactions that take place at the surfaces of gold nanospheres and how we can harness those interactions to controllably add molecules to our nanospheres. This work is especially useful when considering that gold nanoparticles show promise as drug delivery systems, and of course, the amount of drug delivered is quite important!

My summer started out by simply synthesizing gold nanospheres (which is a really finicky process), and then moved on to trying to polymerize the intermediary layer. We thought that we could reliably quantify the amount of these molecules on the gold surface due to the relative lack of exchange with free molecules in solution compared to a different intermediary layer, where the molecules freely adsorb and desorb from the gold surface.

A depiction of our free molecule versus the polymerizable version.

However, none of my attempts at polymerizing this molecule worked, and so I moved onto synthesizing a new molecule, which will strongly adsorb to the gold surface and allow us to quantify how much is adsorbed without worrying about a fluctuation in the amount of molecules adsorbed.

The molecule I’m synthesizing.

I am just starting to wrap up this synthesis, so I will start using this molecule with our gold nanospheres and accomplish my goal of quantifying not just the polyelectrolyte coating, but also the intermediary layer. I’m hopeful this will lead to cascading effects of learning how to tune the amount of polyelectrolyte that binds to our gold nanospheres, and lead to more discoveries along the way!

Project 3 (Yesenia): Exploration of Gold Nanoparticles and BSA Interactions Through Surface Chemistry

My project is interested in exploring how gold nanoparticles with known surface chemistries interact with a model protein called bovine serum albumin (BSA). Some examples of the surface chemistries I have worked with this summer are positive, positive-neutral mix, neutral, neutral-negative mix, and negative. For most of my experiments, I am pipetting solutions of nanoparticles (with the examples of known surface chemistry) with solutions of BSA then analyzing them using different instruments. It is very important that in my experiments my spheres do not aggregate. So, to characterize and make sure this has not happened, I use ultraviolet visible spectroscopy to determine the state of my particles. Additionally, I use circular dichroism spectroscopy to determine the secondary structure of the BSA on the particles, such as α-helix or β-sheet as a function of nanoparticle surface chemistry. Knowing and bettering our understanding of how the surface charge of gold nanoparticles can influence the way proteins bind is important in applications such as drug delivery and photothermal therapy. I look forward to continuing to work with the surface chemistry of gold nanoparticles and seeing what biological interactions can be discovered! 

Project 4 (Khristian): Analysis of Citrate-Capped Gold Nanoparticle Uptake During Tadpole Metamorphosis at Varying Temperatures

The purpose of my project is to learn more about how gold nanoparticles impact the metamorphosis of tadpoles at different temperatures. Gold nanoparticles are used in a variety of consumer products from clothing and cosmetics to paints. Due to their versatility, gold nanoparticles will inevitably end up in waterways due to dumping and other ways of pollution. Through my project, we are hoping to learn more about how gold nanoparticles, at relatively low concentrations, may impact the growth of aquatic animals. As global warming becomes more of a pertinent issue, it is also valuable to learn about how that may play a role in the growth of the same tadpoles, so I am working with tadpoles that had been exposed to gold nanoparticles at 3 different temperatures: 15, 20, and 25 °C. 

Figure 1: Tadpole School Picture.

The procedure for my project includes obtaining the tadpoles from Dr. Fong’s lab where they have been well taken care of for several months. I weigh each tadpole and dissolve them in concentrated nitric acid in their respective vials. I then use a hot plate to evaporate the acid overnight. After letting the vials cool, I resuspend them in 10% aqua regia, which is made of HCl and HNO3. Yay, strong acids and bases! I then use the Sonicator named Hedgehog (which has a mustache!) to get all of the solid floating off the sides of the vials and into solution. Lastly, I filter each solution into a conical tube until it is time to use the ICP-OES. During this time, I also make calibration curves, which are useful for finding how much gold was in each sample. Once I find out how much gold was in each sample, I do a few calculations to find the micrograms of gold per gram of frog. At the time of writing this, it looks to me that the tadpoles at 25°C uptake the most gold, but I still have dozens more tadpoles to process. Another interesting note is that many of the tadpoles at 15°C have not reached metamorphosis yet, so they are being exposed to the nanoparticles for an extended period compared to the other temperature groups.  This situation could potentially mean that the tadpoles at the lowest temperature will uptake the most gold, so it will be interesting to see what happens!

One extremely important part of my project is keeping everything clean and reducing the risk of contamination. Since the NanoLab has been working with gold for several years, it is likely that some of the tools and glassware have been exposed to gold. In order to reduce the risk of contamination in the tadpole samples, I have a long cleaning procedure for each vial and other glassware I use.

Lab Shenanigans:

Some of us on the DC Trip featuring the Smithsonian elephant, molecules, and a gold exhibit (to stay on theme of course).


MagDen Group: Creating Supernovas in the Lab

Fifty years ago, if scientists wanted to understand the dynamics of phenomena in the universe (e.g., supernova explosions), they would have to point their telescopes in the sky and wait around for something to happen. This could take hundreds, thousands, or even millions of years.

We can’t wait around that long!

However….., we can now create tiny supernovas in the lab using powerful lasers. These lasers can create hot, fast plasmas that mimic the conditions of supernovas, galaxy clusters, and beyond. Supernovas that are parsecs in length and develop over hundreds of years (in space) can be scaled down to the size of a baseball and develop within fractions of a second (in the lab).

Why would we create tiny supernovas? Sure, they’re pretty cool, but there’s some world-leading research actually being done with them. Our research question is: What are the origins of the magnetic fields in the universe?

Sooo… why are magnetic fields important, you ask??  To our knowledge, magnetic fields did not exist at the on-set of the Big Bang but instead were created years later during the formation of large-scale structures such as galaxy clusters, filaments, and voids. Furthermore, magnetic fields are like the invisible glue that helps keep objects in the universe together and play a vital role in the formation of compact objects such as stars and galaxies.

This summer, we explored turbulent dynamo theory—the holy grail of laboratory astrophysics—a condition where magnetic fields begin to dominate the dynamics of a plasma.  Only one laser in the world can produce this condition, the National Ignition Facility, and our group has laser time there!

NIF – National Ignition Facility

(maybe you’ve seen this laser in the recent Star Trek film…)


Our current understanding is that magnetic fields in our universe developed over 3 stages:

1. Small fields were seeded by, for instance, misaligned density and temperature gradients (Biermann Battery mechanism).

2. These small seed fields were then amplified by turbulent motions (e.g., a supernova hitting a cloud bank) much like ripples on a pond become chaotic when encountering rocks and plants.

3. Lastly, the fields continue to amplify until they reach a turbulent dynamo, where the magnetic energy becomes comparable with the kinetic energy of the plasma.

To test this understanding, we need to do laser experiments!  Before using NIF, we need to test our theory on a “smaller” laser facility.  Let’s head off to New York to use the second biggest laser in the USA…no big deal…

Our Trip To Omega Laboratory for Laser Energetics

At the beginning of summer, we had the incredible opportunity to visit the Omega Laser Facility at the University of Rochester, one of the largest laser labs in the world, and witness a laser shot experiment. It was a thrilling experience, where we toured the facility and met our professor’s amazing colleagues who led the experiment, each doing their magic for the success of the shot day.

In preparation for this major experiment, our professor trained us on various plasma diagnostic techniques. We learned about Thomson scattering, Bdot probes, GXD analysis, and many more. This training was not only educational but also eye-opening, giving us a taste of the real-world applications of the theoretical knowledge we had been learning throughout our school years.

The Omega Laser Facility itself was exhilarating. Walking into the lab, we were struck by the sheer size and sophistication of the setup. When on tour, we were able to see the massive laser systems and intricate diagnostic equipment that filled the spacious rooms. The atmosphere was filled with innovation and precision, reflecting the dedication and expertise of the scientists working there. It was a vivid reminder of the incredible advancements in plasma physics and the potential for future discoveries.

On the day of the laser shots, the four of us, along with Professor Meinecke’s colleagues, gathered at Omega early in the morning to start the experiment. We began with a briefing where everyone—I mean “everyone” such as technicians, mechanics, electricians, physicists, and many other specialists—filled the room. The atmosphere was tense (probably because we undergraduates were nervous at such a major place filled almost entirely with laser experts), but amazing. Seeing such collaboration and great minds working together was inspiring.

The most nerve wracking but exciting thing was the countdown of every laser shot itself.
10,9,8 ….. (Time for the shot…)
7,6,5….. (What if it fails?)
4,3,2 ….. (Let’s hope we don’t hear anything… because if we hear something, it means something is broken)
1……. (Silence)… the whole room is silent.
“The shot was successful”…. I believe with every countdown, we are closer to innovation and discovery.

The visit to Omega LLE was more than just a field trip; it was a window into the fascinating world of physics and the dedicated professionals who bring it to life. Seeing these experts in action, applying complex techniques, and working with cutting-edge technology was both inspiring and motivating. This experience reaffirmed our passion for the field and provided a glimpse of the exciting career paths that lie ahead in the realm of scientific research.

Now…. Let’s meet the members of the MagDen!

Our Professor…. drum roll…. Jena Meinecke!!!

Let us introduce our AMAZING Professor Jena Meinecke! She conducts experiments using the largest lasers in the world to understand the origins of magnetic fields in the universe!!! Oxford graduate, new mother, rock climber, DDR master, and enthusiast of the Zelda series, she brings a wealth of experience and passion to her work.

Filled with smiles and care, she always comes to the office thinking about how to best prepare us for the world of physics research. Also, we get to meet “Lil Professor Meinecke” (baby Lander) from time to time, adding even more joy to our learning experience.

Meet Darshan!

Hello, My name is Darshan, and I’m from Nepal. I’m one of the rising sophomores working under Professor Meinecke this summer. I am majoring in Physics and CS and hope to be a researcher one day. In terms of hobbies, I like reading and playing games with friends (who make life so much better).  If possible, I’d also like to be a writer, though I don’t think I’m any good at the moment.

Currently, I am working with Professor Meinecke on a new Gated X-ray Detector (GXD) diagnostic, resulting in a publication. GXD simply takes a picture of the light emitted from a plasma to determine its temperature. This is the first completely passive temperature diagnostic used on such experiments, which can help physicists understand their plasma (e.g., a tiny supernova) without disturbing it.  The GXD method is also easier to use, as you just aim and take a ‘picture’; no secondary lasers and measuring instruments are needed.

A bit of context: When creating a plasma, we want to know 3 big things: the density of the plasma, the temperature of the plasma, and the speed at which the plasma is moving. On a laser shot, we take two pictures with GXD, each with a different filter on it. By comparing the two filtered images, we can create a 2D temperature map of our plasma!

At the beginning of the summer, we went to LLE for a million dollar laser shot day. We toured the facility and spent an entire day working alongside researchers from all over the world. Though we obviously weren’t responsible for the laser shot itself, we observed everyone else in their natural habitat and learned how laser experiments are run (at the big leagues!!). Stressed and confused, as research should be. We worked with the Oxford and Rochester grad students to organize the data from the laser shots and run some preliminary analysis.  My responsibility was to monitor the GXD diagnostic and determine the temperature of our plasmas.  What this really meant was checking that the cameras weren’t oversaturated with light and soaking up every bit of knowledge I could from these impressive collaborators!

A sample of how a GXD picture looks like! Very cool!

Meet Iveel!

Hi! My name is Iveel, and I am a rising sophomore majoring in physics and computer science. At first, I was planning on minoring in physics since I already had a physics background. After taking classes here, I fell in love with physics all over again, thanks to my peers and the amazing physics professors. This summer, I feel incredibly blessed to have the chance to work under Professor Meinecke. She has opened doors and provided opportunities, showing me places to grow and learn, marking the true beginning of my journey in physics. Without X-Sig and this unforgettable summer, I would still feel like a ship adrift at sea, searching for direction. 

Before the LLE experiment, we learned about various plasma diagnostics, laser facilities, and the relationship between plasma and magnetic fields to prepare ourselves for the Omega laser experiment. My fun and informative project was to design posters that summarized almost everything that would be hung outside our professor’s office. I am basically assuming the role of “master of all the material” at this point (diagnostics, lasers, theory, and simulations).

Also, I had the chance to learn from Professor Meinecke’s colleague, Professor Petros Tzeferacos, who is developing the Flash Code at the University of Rochester. This powerful code is employed in a number of applications, from astrophysics to fusion reactions and many things in between. I am hoping to continue studying Flash code and learning simulation while learning hands-on work in the lab. 

Example 2D Flash Simulation of the Magnetic Field ∼ 8 MG and Rm >> 1.

Having the chance to work under Professor Meinecke has been a great eye opener and unforgettable experience. Currently, I am building my relationship with physics and computer science to determine where I should exist within them.  I’m leaning towards research and computational physics, which means grad school is looking over my shoulder. Other than that, I am from Mongolia, and I am an amateur pianist, dancer and a veteran FPS player. I am a person of many things, but I can confidently say, I will always be in STEM.

Meet Ethan!

Hello! My name is Ethan, and I am one of the very fortunate rising sophomores working with Professor Meinecke this summer. Between the dual degree engineering program and Professor Meinecke’s eagerness to push us to our limits, I have had more opportunities during this internship than I could have ever imagined. This May, we had the privilege to travel to the University of Rochester’s Omega laser facility, where we were able to work alongside some of the most brilliant minds working with inertially confined fusion, and without X-Sig, such an opportunity would have never existed. My work here is focused on the lab itself. My recent work has been dedicated to revitalizing the lab, but I plan to work with Professor Meinecke to fabricate Bdot probes, which will allow us to measure the magnetic fields created by our plasmas. Outside of school, I like to play a few instruments, though not particularly well. I’m also an amateur woodworker, cinematographer, and 3D modeler, and I enjoy playing a variety of video games.

One of six Bdot probes constructed at Oxford University

Workplace Makeover: Welcome to the MagDen

To make our mark as the first members of the MagDen, we are leading renovations on the MagDen lab (just look at that before and after!) while also decorating the space outside Professor Meinecke’s office where we work most of the time. This space now reflects our shared experiences and the collaborative spirit that defined our time here. We hope this space will welcome future students who will have the opportunity to work with Professor Meinecke, fostering the same sense of passion and collaboration.

Andresearch: The Wonders of Biophysics

Overview

Our lab (Macyn, Maya, Eden and Kyle) has three different experimental areas for the summer, all involving DNA!

Senior Investigative Researcher: Macyn

Hi! It’s the Senior Investigative Researcher, Macyn Rosay, of the Andresen Lab. I’ll give a somewhat brief rundown of my project: Isothermal Titration Calorimetry Studies of DNA Condensation. I have been working on this project since last summer, though I have previously worked with fellow lab member, Aubrie Hetherington, and have made a lot of progress! In this project, I hope to condense both linear and plasmid DNA with an inorganic salt called Cobalt Hexammine, which interacts electrostatically with the negatively charged DNA. Since DNA carries a negative charge, it does not want to stick together. Thankfully, the Cobalt Hexammine has enough of a positive ion charge that counteracts the DNA’s negative charge and forces it to clump together. The purpose of this project is to watch the full two stages of DNA condensation as they happen. I do this by monitoring the temperature changes in DNA as the salt gets mixed in. By condensing the DNA, we will hopefully get a better understanding of the physics behind this process, as it has not fully been studied before.

Currently, I am using DNA from salmon testes, which is my favorite thing to mention whenever I tell anyone about my research. 

This is a picture of the salmon DNA! It looks like string to me!

This DNA is linear, which means it is the same kind that we have in our cells! However, the salmon DNA is a lot shorter than the DNA that we typically have in our cells. One of the next steps in my project is to use DNA of different lengths to see how that could impact the condensation process, which I am very excited to see! I will also be experimenting with another kind of DNA called plasmid DNA. Unlike linear DNA, plasmid DNA is circular and is typically found in bacteria, and I give a huge shout out to the Buettner Lab for graciously donating some of their supply!

The machine that I use to do most of my experiments is called the Isothermal Titration Calorimeter, or the ITC. The machine has two cells. One is the reference cell, which just has water. The other cell, the sample cell, holds our DNA samples. The ITC keeps both cells at the same temperature. Then, a syringe gets loaded up with our salt sample, which gets pushed into the sample cell.

This is a diagram of the ITC taken from a past member of the Andresen Lab, Tam Nguyen.

As our salt slowly gets injected into the DNA, the ITC will measure the change in the DNA’s temperature by comparing it to the constant temperature of the water. Basically, the ITC uses the water cell to measure the temperature of the DNA. The data from this looks like a bunch of sharp peaks that gradually get smaller and then finally will flip as the DNA condensation is fully finished. 

This is a graph from the ITC! There are two distinct hills that the peaks form before flipping, representing the two phases of DNA condensation.

This project has definitely been an uphill battle as I am constantly adjusting the concentration of the salt samples and analyzing the data as it comes in. However, I have had a lot of fun with it and am very excited to see where it goes!

On the Computer: Maya

I (Maya) am taking a computational analysis approach to ion competition and DNA. Before I began running simulations, I had to gain an initial understanding of the experiments, as well as the programs I would be using to test them. As a physics major, I had to do a lot of outside research to understand the biology aspects of DNA electrostatics. In short, I learned that different ions react differently with DNA due to varied charges. Because DNA is a negative charge, +1, +2, and +3 (etc.) ions will be uniquely attracted to the strand, and negative ions will be uniquely repulsed. In my experiments, we simulate a strand of DNA in a 9 x 15 x 15 nanometer box of water and add different concentrations of sodium (+1 charge), cobalt hexamine (+3), and chlorine (-1).

Using Linux, I implement the Gromacs program to run these simulations. Gromacs is a program used specifically for molecular dynamics of proteins and nucleic acids using inputs and outputs. After a tutorial and plenty of practice simulations, I am now running a plethora of simulations with different values of sodium, cobalt hexamine, and chlorine. We are looking at two specific results from this data: the bound concentration and bulk concentrations. The bound concentration is a radial integration value of the number of ions that surround the DNA on average over time, while the bulk concentration is the average number of ions that exist further away from the DNA, when it is not attached to it. To achieve these values, I put the simulations into Python for graphical and numerical analysis.

Figure 1: The simulation results for 14 cobalt hexamine (red) and 100 sodium (blue), where chlorine is green. The x axis represents the radius from the center of the DNA while the y axis represents the ion concentration.
Figure 2: Watching the simulation from Figure 1 run in a program called VMD (Visual Molecular Dynamics).

In Figure 1, we can see the bound concentration is the value of the area under the peaks closest to the DNA, while the bulk concentration is the value where the concentration levels out. In Python, we can find exact values for both of these numbers. My and Andresen’s goal, however, is to analyze the competition between the +1 and +3 ions and their resulting bulk concentrations and create an equation that can predict the bulk values. Currently, I am finding output bulk concentration values for sodium and cobalt hexamine depending on the input concentrations. Once we have ran enough tests, we can start considering equations that can theoretically bring the variables together.

Kyle and Eden on Nucleosomes & Chromatin!

When we first started our research this summer we were working on finding the best digestion for our chromatin. A digestion is a way to get a fragment of a larger substance, in our circumstance, we are digesting chromatin to get nucleosomes. Our Senior Investigative Researcher (SIR) Macyn Rosay helped us to begin this process and slowly got us to do the process on our own. For the past week, we have been doing the digestion on our own, where we were looking for the best time for the 15-unit digestion. In the prior week, we had done a unit digestion that led us to 15 units the best for the digestion of our chromatin (so many gels). Unit digestion is a way for us to find the baseline of Micrococcal Nuclease (MCN) to use to get the most amount of nucleosomes. From there we did a time digestion that ranged from 10 minutes to 55 minutes, and from this digestion, we concluded 30 minutes was the best for nucleosomes (see Fig. 1). Since 30 minutes was the blessed digestion we had (finally) moved to the next step which is mass digestion (only one more gel yayyyyyyyy). The digestion process will be explained more in-depth later, for now, enjoy our fluorescent gel.

Figure 1: 15 unit Time Digestion of Chromatin

Once we (finally) made a good gel, we could move on. We spent the rest of the day digesting chromatin. We separated a sample of 50 mL of chromatin into two separate test tubes with 25 mL in each just to make sure if we mess up (which we won’t), we are not using up all of the chromatin that we already have. If we do, then it’s back to the farm to get more chicken blood!

We then added 4.5 mL of MCN to each of the two test tubes filled with chromatin and then centrifuged them. After that, we equally separated this new solution (chromatin + MCN) into 5 test tubes with 5 mL each and heated these samples for 30 minutes at 37 ℃. It was now time to make (another!) gel (and listen to Lana Del Rey of course).  Once 30 minutes had passed, we combined the 5 samples and added 1.25 mL of EDTA before putting it on ice for about 10 minutes (time for more Lana).

Next, we prepared two samples for the gel, one with 5 μL of chromatin, 5 μL  proteinase K, and 0.5 μL SDS. The other sample had 5 μL of digested rather than undigested chromatin. We then placed these two samples into the isotemp for 50 minutes at 50 ℃. 

It was now time to move on to a higher-power centrifuge, which Professor Andresen taught us how to use. We added the digested chromatin to two centrifugal filter units and let those spin for about 10 minutes. In the meantime, we made a sample of 1.0 M NaCl which we later used to make 1.0 L of TEM buffer (Tris, EDTA, NaCl). 

We then finished the digestion and loaded the gel before letting it run for about 2.5 hours. While it ran we took a lunch break at the world-renowned Bullet Hole (it is THAT good). Once they were ready, we analyzed the gels and got the thumbs up from Professor Andersen (YAY).

Figure 2: Digestion of Original Chromatin & 30 min Digested Chromatin

So through some rough patches in the first few weeks, we made a breakthrough, but even when we were going insane we always had great music playing.

Long time, no snooze……

Welcome to the Buettner lab! We are a lab of five crazy individuals who have created a strong bond through our love for chemistry. As a lab, we conduct bioinorganic chemistry research, which is the study of metals in biology. The objective of our research is to understand how nature uses proteins to control metals from unwanted reactions. But before we introduce you to all the chemistry we do, let’s introduce you to our team!  

Hi, my name is Bonnie Coley! I am a rising senior majoring in chemistry from Camden, New Jersey. You can almost always find me hiding by the CV yelling at my twin, Terry. I love to spend a ton of time with my friends and am currently working on becoming TikTok famous (@bonniecoley- follow me please). I like to think that I am the life of the lab- I bring most of the noise and laughs. This is my second summer in the Buettner lab and my project this summer focuses on studying the binding aspects of our arginine proteins, which have histidine and arginine residues in the active site, to make them behave more like haloperoxidases. 

Hey, my name is Raphael Rudatsikira, but most people call me Rudy. I’m a rising sophomore majoring in biochemistry and molecular biology. I’m from Kampala, Uganda, and I’m on the swim team here at Gettysburg. You can usually find me by the UV or CD, but if I’m not there, I’m probably running around the lab desperately trying to find my samples (which I may have forgotten to label)- but I’m starting to figure it out. I spend a lot of time talking to myself in the lab which confuses anyone who randomly walks in, which leads to a lot of laughs. Outside of the lab, I can usually be found lifting or playing basketball, both of which I love. 

Hi! My name is Sarah Marcus, and I’m a rising junior chemistry major. I’m from Flanders, New Jersey and this is my second summer in the lab, which means that Bonnie has spent a lot of time forcing me out of my shell. Outside of the lab, I love to spend hours at the gym and end my nights with a good book. I am apparently the mom of the lab, but that might just be because I force Bonnie to eat vegetables (it’s a fight every time). They claim that I’m the only calm one in lab, but I think that’s because I spend a lot more time listening to Bonnie than I do talking. 

Hi! My name is Savarna (Bella- jk) Goutam, and I am a rising junior chemistry and health sciences double major. I was here last summer (I hope you remember) in the Buettner lab and did some cool chemistry with proteins, DNA, and metals. I’m originally from Kathmandu, Nepal and have spent a lot of time cooking, shopping, and working out this summer. I’m currently watching the show ‘Money Heist’, which I highly recommend. I LOVE to sleep, and I will put up a fight if someone takes my lab spot (it’s the only one in the sun). You can usually find me making my gels or doing the long trek to the ICP in Masters, but no matter where I am, I’ll always be dressed cute.  

Savarna here again, but this time I’m introducing our mentor, Dr. Kate Buettner. She is from outside Cleveland, Ohio and has worked at Gettysburg College for the past 8 years. She loves baking and trying out different cuisines (and we ABSOLUTELY DEVOUR the food she makes 100% of the time). She guides us through all our experiments and ideas and helps us understand bioinorganic chemistry. Having the four of us in lab 8 hours a day and entertaining our random-est questions is not for the faint of heart but she somehow does it every single day. We all are very thankful that she decided to have us in her lab this summer and provide this wonderful opportunity for us to meet the protein family 🙂 

Hi! We are the Due Ferri (DF) protein family, the real stars of the show. We are a family of computationally designed proteins which were made to bind to two iron ions, don’t worry we don’t discriminate, we bind to lots of other metals too. In the past, we’ve shown our ability to use titanium and zinc to chew up DNA, but we are flexible and can be used to model lots of other things (#multitasker😤).  

In the lab we have two main focuses: making our proteins function as haloperoxidases and hydrolases.  

Haloperoxidases: 

Now you might be wondering what a haloperoxidases is… 

They are enzymes that make important intermediates for drug development, and they are the only way that you can carry out these reactions in water. Making them more environmentally friendly compared to current systems. Interestingly, these enzymes often use vanadium, and can keep the reactivity they want while blocking unwanted reactivity. With the use of the DFsc protein system, we have been trying to mimic these enzymes and developing assays that enable us to monitor their activity and binding.  

Bonnie: Cyclic Voltammetry 

A graph of different colored lines

Description automatically generatedFor the binding aspects of haloperoxidases, we monitor the redox potentials by using cyclic voltammetry. Vanadium is a good metal for electrochemistry because it has many accessible oxidation states. We observe potential peaks by running vanadium without any protein presence in the sample which is labeled as

𝑉𝑂𝑆𝑂4𝑉𝑂𝑆𝑂4

1.0x and 2.0x. Vanadium in the presence of protein is labeled 3R 1.0x and 2.0x. Compared to the vanadium alone peaks, we can see when protein is presence the potential peaks shift more negative. The tells how that there is some metal binding with our proteins.  

Sarah: NMR 

With the use of the DFsc protein system, we have been trying to mimic haloperoxidases enzymes and develop assays that enable us to monitor their activity. Last summer, we spent a lot of time analyzing color changes with the UV-visible absorbance spectrometer and the plate reader, both of which are instruments that measure the light absorbed by our samples at different wavelengths, ultimately enabling us to track enzyme’s kinetics so we can get a better understanding of what is happening with the peroxidases (even allowing us to do this at different temperatures!). However, we didn’t have much success with this last summer, so this year we are switching things up! 

Recently, we have been attempting to mimic a decarboxylative halogenation reaction of an indole to determine how well our arginine proteins mimic haloperoxidases (reaction below). 

Decarboxylative halogenation reaction and conditions. 

A decarboxylative halogenation reaction basically means that we want to remove the carboxylic acid (CO2 H) and replace it with a halogen, specifically bromine (Br) in this case. The biggest part of this experiment is trying to see if we are actually forming our desired product, which we check using carbon and proton NMR. NMR, or nuclear magnetic resonance, is an extremely useful tool for determining the structure of organic compounds, providing a spectrum with peaks for each carbon and proton in the molecule at different points- or shifts- on the x-axis based on the proximity to surrounding atoms or functional groups.  Looking at the spectrum below, we can see that there is a peak between 160-170 ppm in the green, red, and blue spectra, which is representative of the carbon in the carboxylic acid that can be seen in the starting molecule. In performing this reaction, we are looking for this peak to disappear, as this would indicate that the carboxylic acid carbon was replaced with a bromine- a halogen, giving the desired product. We haven’t had much success with this because the signal has been so low, but we’re hoping to nail down some solid conditions and get some answers.  

Carbon NMR spectra of decarboxylative halogenation product using E11/44R. 

Rudy: The Dynamic Duo  

This summer we have two new additions to our all-star team of proteins. The two new recruits have a lysine in their active sites at positions 74 and 104, making them more like the actual haloperoxidases.  Over the past few weeks, we made our new proteins and now we are working on characterizing them and measuring their binding to different metals (amv, voso4, zinc) using cd (circular dichroism) which allows us to look at the protein structure when bound to metals. The plot below shows that our new protein is more structured with a higher concentration of metal until 2.5 times the protein concentration before leveling decreasing.  


Hydrolase: 

Again, it would probably be a good idea to explain what a hydrolase is….  

To put it simply, hydrolases use water to cleave bonds. Specifically, we are interested in using them to cleave phosphate bonds in DNA. This could have many useful applications in therapeutics and pharmaceuticals. Our lab ancestors showed that DF proteins can cleave DNA when bound to metals like titanium and zinc. Currently, we are working on building off that idea and measuring the DNA cleavage reactivity and metal binding of our protein family using several hydrolysis-prone metals like Zn, Co, Fe, Mn, Ti, and V. 

Savarna: Studying reactivity 

Since May, I have been doing experiments to confirm the binding of metals to our proteins, which will hopefully give us good metal to protein ratio. For this, I use the ICP-OES instrument, which allows me to determine the concentration of each element in my sample. The instrument is in the Andresen Lab over at Masters Hall. Good Days with less humidity are what I pray for on the days I have to run back and forth between the Masters Hall and the Science Center to use the ICP. I am very excited to see what my results from this summer look like! 

Another project I have been working on is studying the reactivity of two substituted proteins 3 His and 4 His (which are the DuFerri proteins with Histidines at the 3 and 4 positions respectively) with DNA, since they have DNA cleavage abilities when bound to metals. I run one gel every day (except The Weekend), exploring different metals, proteins, and conditions.  

This is what my gel looks like after it runs for about 70 mins. 

The left picture is what my gel looks like after I run it for about 70 mins. 

The picture on the right is an image of the gel I get using the ChemiDoc downstairs in the Bio Department. The different bands on the gel image show me the different forms of DNA in my samples. I can use this to qualitatively asess how much DNA cleavage I am getting with different proteins and metals. 

Sarah: BNPP Assay 

 
We have also been working on a BNPP assay. BNPP, or bis(p-nitrophenyl) phosphate, is the substrate we are using to try to determine the enzymatic activity of our histidine and tyrosine substituted proteins. In other words, we want to see if we can quantify the rate of reactivity so we can figure out how active our proteins are in different conditions. However, instead of getting the bright yellow color like we are supposed to see form over time in this reaction, we are getting some unexpected white precipitate, or solid, formation, meaning that we have to tread carefully with our conditions going forward to try to stop this from happening. We’re trying to measure this color change using the UV-visible spectrophotometer and the plate reader, both of which we explained earlier. 

Hopefully, we’ll start using the ICP-OES soon to quantify the vanadium binding of our proteins and get some success there while we work on nailing down my conditions for some of our other projects. After all, we would welcome promising data with open arms! 

We hope you guys enjoyed our blog! Come stop by our lab to sing Snooze by SZA, or grab a few snacks, but make sure to clean up after yourselves. Have fun and stay curious.  

A Day in the Life of a GC NREUP Participant – Friday Edition

Along with discussions of our math modeling research, we spend time during our Friday meetings reflecting on how traditionally minoritized individuals in math find and create supportive communities. Sometimes we read book chapters that include personal narratives and other times we explore what opportunities are offered by different professional organizations; then we arrive ready to share highlights and takeaways on Fridays.  Underlying this is the acknowledgement that, as we progress along our math pathways, we face particular hurdles and bring specific strengths based on our identities. Finding inspiration from and community with others helps propel us forward. 

In order to recognize the progress we have made towards a more inclusive mathematical community, it is important to understand where we have grown from. As recently as 1982, women have been barred from enrolling in certain colleges; their academic potential stonewalled without reason. It wasn’t until Brown vs. Board in the early 1950’s that African Americans won the right to an integrated education. Recent history has been filled with stepping-stones that lead to a brighter future of dedicated and passionate minds. We are not yet finished but have come a long way towards the equity of all people within mathematics.

In recent years, the math community has already seen positive changes especially when it comes to more advocation of women in the field. For example, the Association for Women in Mathematics (AWM) has played a crucial role when it comes to giving women more access to things such as networking, newsletters and publications opportunities, travel grants, and many other opportunities for exposure. However, there is still a discrepancy when it comes to a woman’s “household duty” and their advancement in academia which is still something that goes on today. Even though there are still improvements to be made, there has been a lot of progress when it comes to the opportunities and exposure as a woman in the math community.

Another example, todos-math.org offers bilingual resources for Latino families that extend learning mathematics into the home rather than just concentrated at school. These resources have allowed students of all backgrounds to have a fairer opportunity in their schooling and encouragement and motivation to continue their education as far as they can. As a community, we have steadily worked on equality and every day with new resources we are one step closer.

We also talked about The Center for Minorities in the Mathematical Sciences, an organization that unifies and uplifts the voices of minorities in mathematical sciences. They host several events that allow minorities involved in math to socialize and connect with each other. One interesting event is their storytelling event. During the event, mathematicians gather and share how they fell in love with mathematical sciences and what career paths it led them to. This gives minorities a chance to discuss and share their perspectives and upbringings in the world of mathematics, also providing the audience with an inclusive view of the career field through the lens of someone different from the majority. Another useful resource we discussed is their spreadsheet of different positions in the math field and who and where they are offered. There are financial discrepancies when it comes to STEM positions in general. Some institutions or companies offer employees different salaries and benefits. These salaries and benefits can be offered at a lower rate to some people compared to others. “The goal of this spreadsheet is to strengthen the negotiating power of underrepresented mathematicians—especially mathematicians of color—by providing financial transparency” (The Center for Minorities in the Mathematical Sciences).