Hey there, welcome to the Kittelberger lab! This summer we are working to develop the Cell Biology lab curriculum at Gettysburg College by allowing students to manipulate glowing proteins in cancer cells. The current Cell Bio lab includes an independent project where students use chemotherapy drugs to see the effects on overall cell growth or death. Our goal is to make specific proteins glow fluorescently within these cells so that students can manipulate them on a subcellular level. Rather than just seeing the cells microscopically, they will be able to see the fluorescent proteins within. Targeting specific glowing proteins rather than whole cells opens up a range of new experiment options that students can choose from and allows them to be more creative. Our research will give them a better learning experience as they will be able to visualize intracellular components and create more complex independent projects connecting lecture material to the lab.
Meet The Crew:

This is Dr. Kittelberger. We’re not going to make fun of him because we all need letters of recommendation.

This is Krissy. She’s the grandmother of the lab, in bed by 10pm every night. She doesn’t like the days spent in front of our computers, can’t do all this technology stuff

This is Jehan. He’s the voice of reason and a high-functioning lab tech. Please contact modyje01@gettysburg.edu for all of your lab tech needs.

This is Alessandro. He’s the annoying little brother that Krissy never had. The two of them are constantly bickering.

This is Natalie. She’s the freshie of the lab. She likes to smile and nod and keeps her distance from all the bickering.
How to Make Proteins Glow
Visualizing fluorescent proteins requires that a given protein is indeed glowing. There are a variety of methods by which one can fluorescently label proteins–such as with antibodies as well as fusion proteins.
Fusion proteins, like antibodies, can be attached to a fluorescent tag that will glow under suitable conditions. However, the tag utilized in fusion proteins differs fundamentally from that which is used in antibodies. As the name suggests, a fusion protein is a protein that is fused to a fluorescent protein (in this context), whereas the antibodies utilized this summer are attached to a fluorescent molecule. The discovery of the first fluorescent proteins was made in the 1960s, and 30 years later, these proteins were cloned and have since found a plethora of applications owed to their fluorescent properties.
To express the fluorescent fusion proteins in vitro, we utilize the central dogma, in which DNA is transcribed into RNA that is translated into a protein. In this context, this process predicates the need for DNA that encodes a protein of interest fused to a fluorescent protein. This is often achieved with a plasmid (circular, extrachromosomal DNA that can replicate independently) raised in bacteria. Essentially, one can grow a bacterial culture containing an engineered plasmid, extract the DNA, and transfect cultured cells.
DNA transfection, or the process of getting plasmid DNA into target cells, can be achieved in multiple ways. However, the Kittelberger Lab used lipofection and electroporation to this end. Lipofection uses liposomes–which are composed of a phospholipid bilayer like the plasma membrane–to aid plasmid passage into a cell. In electroporation, the cells are placed in an electric field that creates small “pores” in the plasma membrane through which the DNA can pass. Once inside the cell, plasmids can utilize the cell’s transcription and translation machinery to produce a functional, glowing protein. Finally, we have a glowing protein.
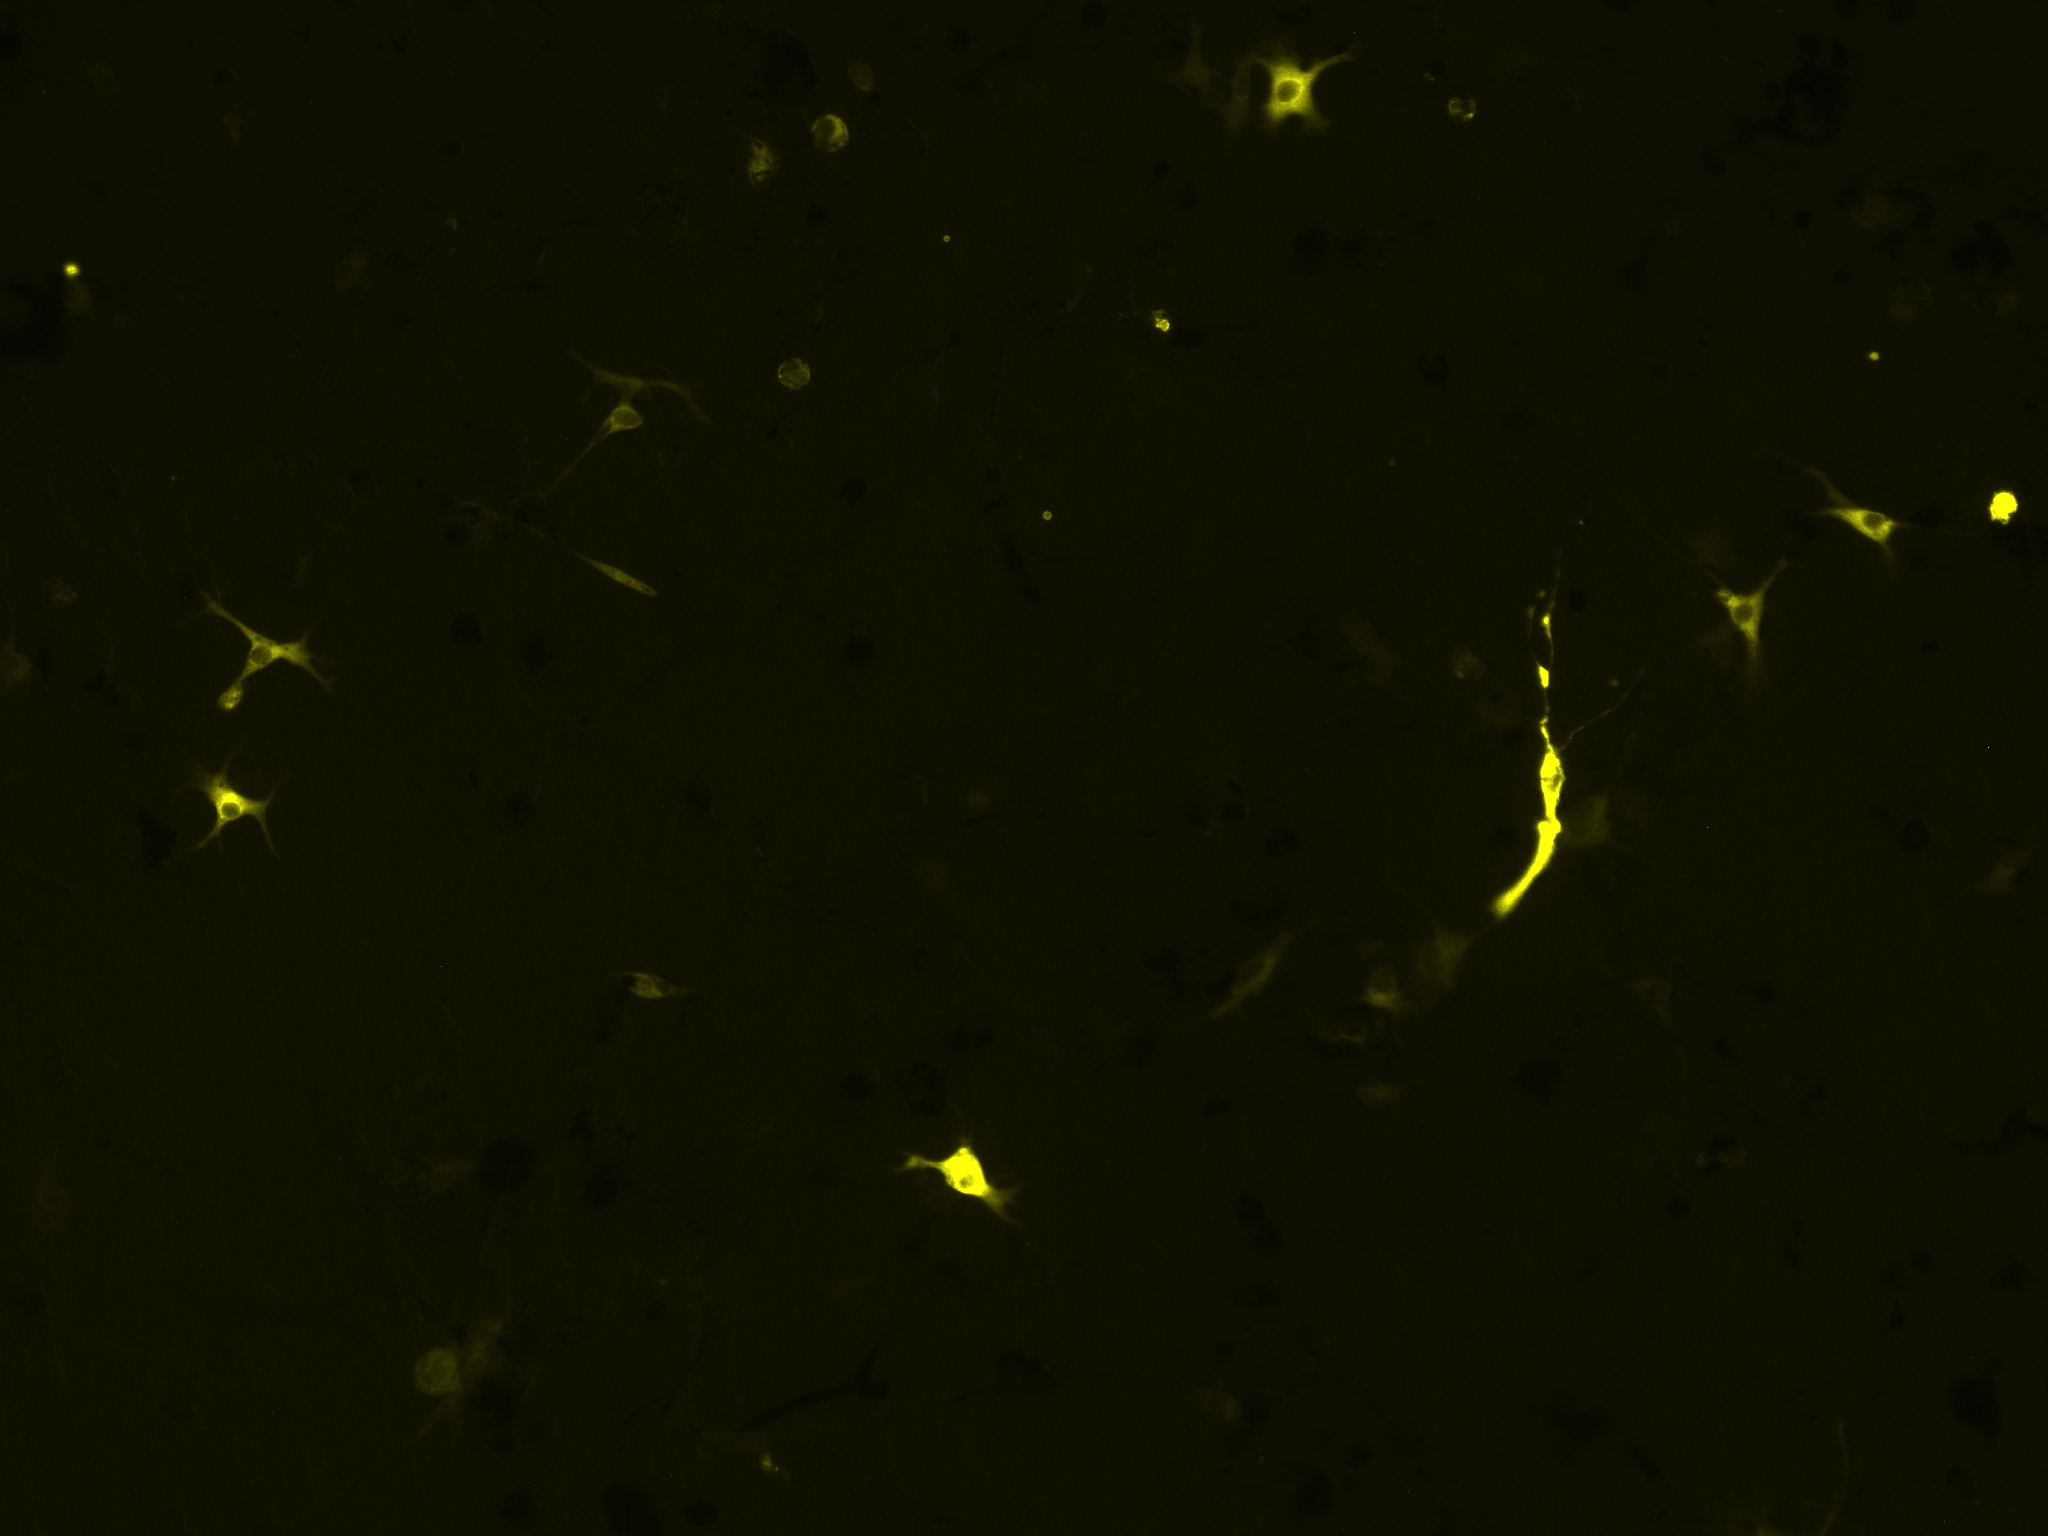


The above images are of calnexin, which is fluorescing yellow due its fusion protein (mGold).
Along with fusion protein tagged plasmids, we also wanted to try and tag some proteins with antibodies and compare the two techniques. Antibodies are protein specific and bind to the protein of choice. When cells are stained for visualization, one exploits an antibody’s natural specificity for a given protein. Once added, antibodies will bind to and illuminate their target. We are utilizing primary antibodies for our proteins as well as secondary proteins that are fluorescently tagged and bind to our primary antibodies. When excited with the right wavelength of light, the secondary antibodies emit their own light and appear to glow. So far we have attempted antibody staining on fixed cells, cells that die in the process of fixing but retain a life-like form, making it easy to visualize them. The whole process involves fixing our cells with paraformaldehyde, using a permeabilization buffer which allows our antibodies to enter the cells, a blocking buffer which prevents nonspecific binding of the antibodies, and our antibody solutions that stain our proteins of choice. We are also trying to stain our cells on coverslips that enable us to utilize high power microscopy and observe our proteins in subcellular structures. Towards the end, we will attempt to stain live cells and potentially do some timelapse imaging to observe how our proteins behave inside cells over time and whether there are any changes in their subcellular localization.


Both of the above images are of cells in which lactose dehydrogenase (LDH) has been stained with a primary antibody targeting LDH-A and a secondary antibody fused to a fluorescent molecule (AlexaFluor 488).
How to See Glowing Proteins
Individuals behind cancer research use fluorescent probes to understand the inner workings of cancer cells. They do this by illuminating their cellular processes and understanding subcellular localizations of targeted drug treatments. In our lab we are utilizing new fluorescent microscopes (EVOSm5000) and EVOSm7000) to help quantify and visualize cultured mice melanoma cells (B16-F10 cell line) that we are staining. Before we could see all the cool stuff, we had to learn how to actually use them. For some context, each of our genes are attached to a specific fluorescent protein, these being mCherry, mGold, mVenus, or good ol’ GFP. These proteins are red, yellow, dimmer yellow, and green respectively. For each fluorescent protein, they have a specific excitation/emission ratio which we had to take into account when picking a filter cube to use. These filter cubes allow for specific wavelengths of light in, whilst removing any unwanted light source. These microscopes contain a multitude of filter cubes and the ability to use more than one at a time can give off some interesting images. Following transfection of plasmids into our cells we were able to see some glowing cells!
We are each working with a 24 well plate and for imaging purposes, we wanted to capture images in different quadrants of each well. For each image that we take, we are really taking three at a time accounting for an image using the filter cube, one in brightfield, and another merged photo. That is a whopping 288 images per day which we analyze! We imaged every 24 hours for three days as we noticed our cells begin to die around day three of imaging.
In terms of quantifying images, we decided to manually count the number of fluorescent cells in a 10X magnification field of view and divide it by total confluence, i.e. number of total cells to get percent transfection. These microscopes have built-in image analysis tools which allow the user to select viable cells to be counted as our “standard” and use a selection tool to block out unwanted space that we didn’t want counted.

The above image is of melanoma cells that have been stained with a blue fluorescent nuclear counterstain (Hoechst 33342).
A Closer Look at One of Our Proteins
When picking genes, we selected those which had a large involvement in tumorigenesis. We focused on ATG16, MEK1, P53 and BRAF, among other proteins. Research has found that the RAS/RAF/MEK/ERK pathway, better known as MAPK pathway, is a large player in melanoma development. Key signaling molecules involved in this pathway include BRAF as well as MEK1. BRAF within this pathway is involved in cell growth and proliferation. A BRAF mutation at codon 600 where glutamic acid replaces valine accounts for nearly 50% of all malignant melanoma cases. Current treatment looks at the use of BRAF inhibitors in combination with targeted therapy for MEK proteins. When BRAF is inhibited, this causes a feedback activation of MEK, another component in the MAPK pathway. This can lead to downstream reactivation and can cause tumor growth and resistance to drug therapies. As stated, MEK1 is a small molecule within this signaling cascade which is downstream of BRAF. It is involved in cellular processes such as cell differentiation and migration. Since it selectively binds here, this causes the phosphorylation and activation of kinases. Therefore if there are issues early in this signaling cascade, this can follow in subsequent steps.
Thank you for checking out our progress this summer. If all goes well, we could be bringing glowing proteins to a cell biology laboratory curriculum near you.
