The Lab Members:

Professor Thompson

I’m supposedly in charge of the nanolab but often I feel like I have no idea what I’m doing. I guess that’s part of doing research, right? I’m lucky to have three wonderful students working with me this summer and you’ll get to hear a little about their work below.
Isaiah Lares
Hi! My name is Isaiah. I am a rising sophomore pursuing a physics and chemistry major. I am working on a project in Professor Thompson’s lab about how changing the supporting cation of a polymer affects polymer adsorption.
Ziang Wang

Hi! I am Ziang. I am a rising senior, chemistry major and math minor. Me and Hana are working on understanding and finding ways to control gold nanorods assembly by using pH-responsive polyelectrolytes. Confusing right? Let us break it down for you!
Hana Konno

Hi! My name is Hana. I am a rising sophomore and a chemistry major. I love traveling and visiting new places. This summer, I am working on a project with my lab partner Ziang in Professor Thompson’s lab (AKA the Nanolab). We have been synthesizing a lot of cool nanorods in the lab, so we will explain some of it down below!
What is the NANOlab about?
If you were unsure, our lab researches gold nanoparticles, hence the name, NANOlab. Research into nanomaterials has been heightened in the last couple of decades as nanomaterials exhibit unique properties that are typically not found in the regular material. There has been a lot of interest in researching gold nanoparticles for potential uses in drug delivery, biosensors, and solar technology to list a few.
One of the projects in the NANOlab this summer is to document the effects of pH on the self-assembly of gold nanorods. This project is being done by us (Ziang and Hana). Controlling the assembly of nanorods is important because the applications of gold nanorods requires an efficient way to assemble nanorods as needed.
I (Isaiah) am conducting the other project being in done in the NANOlab which is to quantitatively analyze the affects of changing the supporting cation of a polymer on adsorption onto gold nanoparticles. This will help us gain insight to the range of electrostatic interactions between gold nanoparticles and applied ligands.
How do we synthesize gold nanorods?


Schematic representation of nanorods synthesis. (Picture of “rainbow” at the end.)
In our lab, we use a two-step method to synthesize gold nanorods. The first step creates a seed solution with all the nanoparticles being spherical. The second step is the growth phase, where the spherical nanoparticles are grown longer. By varying the amount of AgNO3 in the growth solution, we can control the length of the nanorods that are synthesized. We decided to add five different amounts of AgNO3 ranging from 10 µL to 100 µL. The resulting rod solutions show color transition from pink to tan, which we call “rainbow”!
What do we do after the gold nanorods are synthesized?
We first clean our nanorod samples! Because excess CTAB and other polyelectrolytes sitting in the solution for a long time will change the shape of our nanorods. Therefore, we need to clean the nanorods after each coating.

The inside of our centrifuge with some of our nanorod samples.
After the cleaning, we coat them with polyelectrolytes (charged polymers)! The method we use is called layer-by-layer (LbL). As you remember from our synthesis of rod solutions, we used CTAB, so the nanorods are coated with CTAB. Since CTAB is positively charged, we can add negatively charged polyelectrolytes to the solution; the opposite charges naturally attract each other, thus the negative polyelectrolytes will wrap around the gold nanorods. (We use four different negatively charged polyelectrolytes.) The rod solution is cleaned in this step as well to remove the excess polyelectrolytes. Then, we coat the rods (now negatively charged) with pH-responsive positively charged polyelectrolytes.

Polymer coating illustration. The blue layer is the negative polyelectrolytes, the black layer is the positive polyelectrolytes.
In each coating step, the nanorods are characterized with UV-vis, dynamic light scattering (DLS), and zeta potential. UV-vis tells us the amount of light the nanorods absorb and the wavelength of the light that they absorb. As the length of the rods increases, the wavelength they absorb increases. DLS simply tells us the diameter, and zeta potential tells us about the surface charge of the rods. Each is important for us to ensure that each step of the nanorod coating process is done successfully!


From left to right: Graphs of the DLS, UV-vis, and Zeta Potential characterization data.
Now to the pH Experiments!
Once we have our coated gold nanorods, we do pH experiments on them. If you are unfamiliar with what pH is, it is a scale that typically goes from 0-14, 0 being the most acidic, and 14 being the most basic. Our coated nanorods are initially in a solution somewhere between a pH of 5 and 6. Our pH experiments involve pipetting sodium hydroxide (NaOH) into the solution to increase the pH of the solution. Sodium hydroxide is a strong base that when added into solutions makes them more basic (so base for basic), which is why we are using it for the pH experiments.

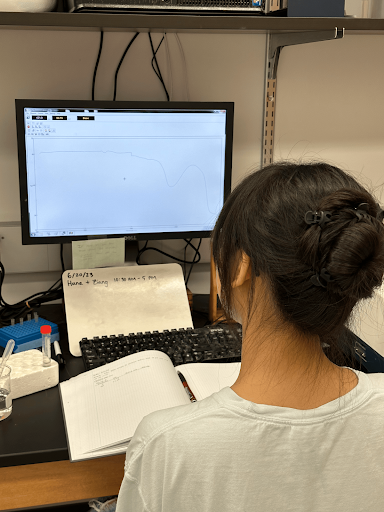
Hana at work as she sets up a pH experiment.
For the pH experiments, we are collecting characterization data (UV-vis and DLS) at 5 different pHs: 9.5, 10, 10.5, 11, and 11.5. The pH at 10.5 is important because this is when the pH matches the pKa of the solution, so chemical things happen that allow the nanorods to assemble.
Imaging the Nanorods
Now you may be wondering if there is a way to see what the nanorods look like and the answer is yes! Using a fancy microscope called transmission electron microscopy (TEM), we can actually take images of the nanorods. It is quite tedious to prepare a sample for TEM analysis, but all of the preparation is worth the cool images. The TEM images are important because they are a visual indicator of self-assembly. Currently, we have been taking sets of TEM images of the control samples (so at the initial pH) and pH samples (these have a pH of 10.5). This past week, the lab drove up to Penn State to use another cool microscope called scanning electron microscope (SEM). The SEM we used is worth a couple million dollars, so it was a pretty big deal to use.


The photo on the left shows a TEM image of the nanorods. The photo on the right shows Ziang looking at a cluster of gold nanorods using the TEM.


The SEM we used up at Penn State. It was definitely worth the two and a half drive to use.
What Else Have We Been Up to?
During our spare time in the lab, we have been extremely busy doing other things like a cool Lego puzzle that members of Professor Buettner’s lab helped us finish (actually, they finished 90% of the puzzle for us…). On a real note though, there is also a lot of data analysis that we do which involves making lots of graphs and tables. And I mean A LOT. Anyway, here’s a picture of the completed Lego puzzle to end the post! We hope you learned a thing or two about the Nanolab!

Changing the Supporting Cation of Polystyrene Sulfonate (PSS)
So for my project (this is Isaiah), I follow the same procedural steps as Hana and Ziang until the first polymer coating where I use a different polymer called PSS instead of PAA. This polymer is a negatively charged polyelectrolyte that has the following structure:

What we are interested in with this polymer is how the supporting cation, in this case sodium, affects the electrostatic interactions between the gold nanoparticle and the polymer. This is so that we can gain a better understanding of the amount of polymer that stays on the nanoparticle since the layer-by-layer technique depends on electrostatics. The main takeaway is understanding the difference between layers of polymer that are tightly attached and more loosely attached to the nanoparticle. And in order to properly analyze this, consistent polymer packing is needed across the polymer which is why spherical gold nanoparticles are being used for my research as opposed to nanorods due to their constant surface. In order to characterize my particles, I use UV-vis spectroscopy, DLS, and zeta potential.
So how are we going to do this? By using a centrifugal dialysis process as detailed below:

Using this process we are able to separate and collect polymer that is not fully adsorbed on the nanoparticle. Depending on what stage of the process the polymer gets separated in, it gives insight to how tightly adsorbed the polymer was. With these filtration samples, I am able to get concentration information of specific elements using ICP-OES/AES (Inductively Coupled Plasma Optical/Atomic Emission Spectroscopy). This technique of spectroscopy utilizes an argon plasma to superheat a sample. In our case these are the dialysis samples. When the electrons of the sample are excited and return to their ground state, a photon is emitted. The ICP contains an array of sensors that collect light at different wavelengths. Depending on what element and elemental wavelength you specify the ICP to collect, concentration data can be collected.
However in order to use the ICP effectively, accurate and precise calibration curves have to be made to compare our sample to which is what I have been doing as of late. For our calibration curves to be up to standard, they need an R^2 value of about 0.9999. This has posed quite the challenge, but the calibrations I have done are getting closer to the desired value. So far I have done calibrations of gold and sulfur. Here are two of them:

Gold calibration curve from 100-1000 ppb analyzing at the elemental wavelength Au 267.595

Sulfur calibration curve from 100-1000 ppb analyzing at the elemental wavelength S 180.669
The data received from the ICP will allow me to calculate exactly what amount of polymer desorbs from the nanoparticle at which stage of dialysis. This can give a degree of understanding to the electrostatic strength of sodium as the supporting cation of PSS.
So What’s Next?
The next steps of this project are to finish making the calibration curves for the ICP and then analyze the dialysis samples that I have made. This will give us data to firstly reinforce data gained by previous students, and secondly new data on the amount of sodium ions that are in solution at each stage of the dialysis process. Furthermore, traditional dialysis techniques will be used in order to substitute the sodium ions of PSS with the following ions: lithium, potassium, magnesium, and calcium. With these newly formed modifications of PSS, the centrifugal dialysis process and ICP analysis will be performed in order to compare the differences in polymer adsorption between each supporting cation. I hope you enjoyed learning about my research, thank you for reading!
